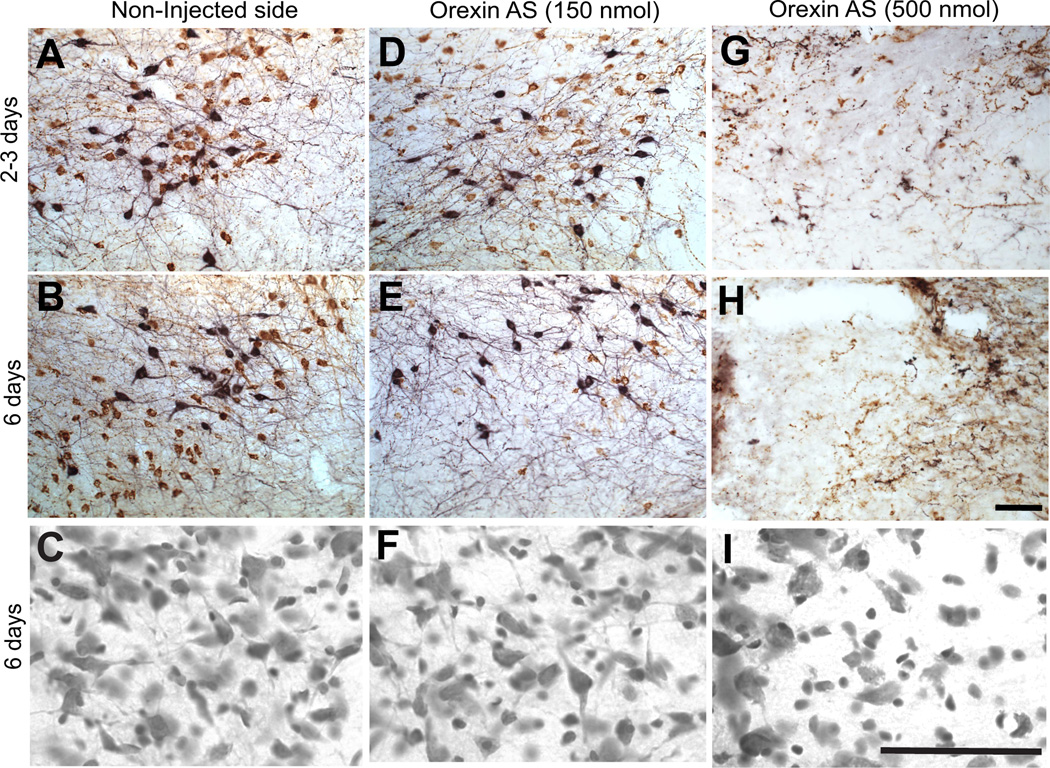
Fig. 5.
Suppression of orexin in the LH visualized by immunostaining. Representative photomicrographs of double staining for orexin (brown) and MCH (black) in LH 2–3 or 6 days post injection in the non-injected (control) sides (A,B,C) and orexin AS injected (D,E,F, low does; G,H,I, high dose). Cresyl violet staining of adjacent tissue from the same sections shown in the middle row (B,E,H) are shown below in panels C,F,I. The number of orexin, but not MCH, expressing neurons was reduced 6 days after orexin AS injection. No reduction of orexin or MCH was observed 2–3 days after orexin AS injection. Apparent toxicity was observed following high dose (500 nm) treatment (G,H,I) by both immunostaining and Nissl staining. All images were taken within 160 µm of the injection site. Scale bar, 45 µm in first two rows at 20x, 100 µm on bottom row of Nissl images at 60x.

