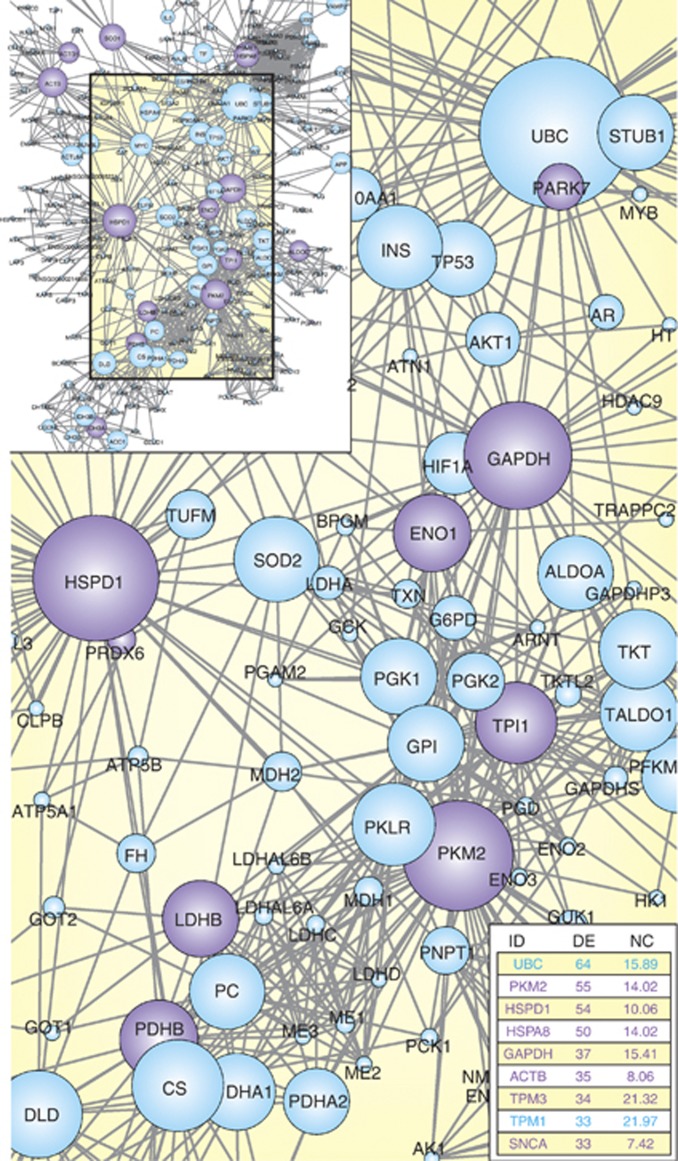
Figure 2.
Protein interaction network involving alcohol-sensitive proteins described by proteomic studies. The figure offers an example of how PPI data from different sources could be integrated with protein expression profiles by weaving molecular interaction networks. These networks provide an easy visualization (by zooming in/out, rotating, using layouts to group nodes, etc) on how sets of candidate proteins are interconnected. Plus, precise analysis of interconnectedness can be calculated, which is particularly useful in the case of large networks. The most connected node is polyubiquitin-C (UBC), a protein involved in ubiquitination pathways. As in case of other bioinformatics tools, data obtained should be verified with additional experiments and researchers should carefully filter out interactions that have not been validated, to avoid possible overinterpretation of related biological meaning. In this case, Ingenuity Pathway Analysis (IPA) functional analysis and previous literature confirm the perturbation of protein ubiquitination pathways in alcoholism. The network was generated as follows. Interacting partners from proteins listed in Table 1 were obtained from STRING 9.05 database (http://string-db.org, settings: homo sapiens, highest confidence 0.900, and no more than 50 interactors). Data were imported in Cytoscape 2.8.3 and a network was generated using the plugin NetworkAnalyzer 2.7. Purple circles indicate the original proteins identified by at least four proteomic studies, and node degree is mapped to node size. DE, number of directed edges; NC, neighborhood connectivity.

