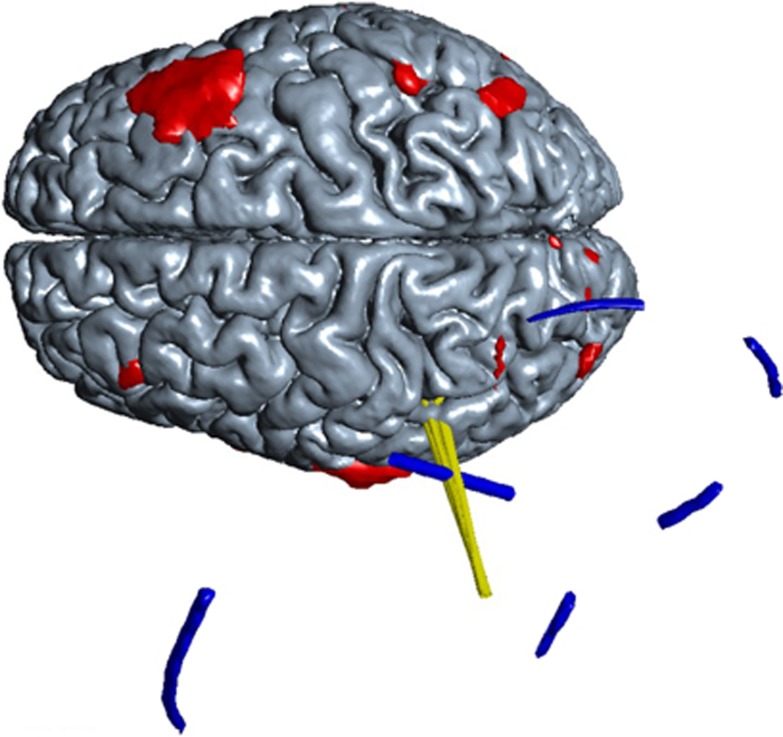
Figure 1.
3D renderings of TMS evoked activation (110% vs. 70%MT) superimposed on a rendering of the gray matter surface, for SMG stimulation stimulated in 2 different subjects (S1 and S2). The estimated TMS pulse center line is rendered as yellow rods, their scatter indicates the accuracy at which the TMS pulse location could be reconstructed. The blue rod rendered perpendicular to the yellow rods indicates the direction of the induced current (the line in between both coil windings, pointing into the direction of the coil handle). The blue tube indicates where water filled tube encircling the TMS coil was located, and is based on the T2 weighted scan made for registration purposes. Small parts of the tube are missing due to limited T2 coverage and low contrast in some parts of the tube.

