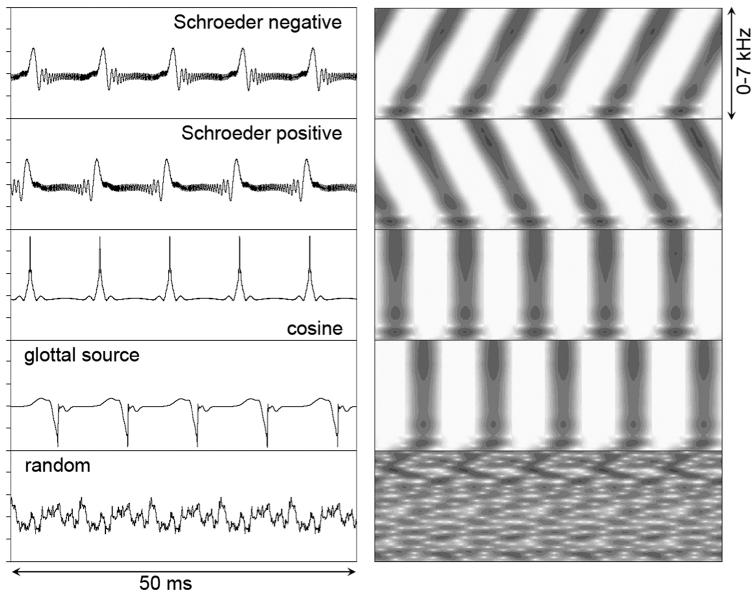
FIG. 1.
Waveforms (left) and wideband spectrograms (right) of 50-ms sections of maskers with the different phase relationships used. The range of voltages is the same for all five waveforms and is on an arbitrary linear scale. All complexes shown were shaped to match the long-term average spectrum of the speech targets. Low-pass filtering at 4.5 kHz was applied at run time but is not reflected in these representations. As is typical for spectrograms, an equalizing filter was applied to the original waveforms in order to “whiten” their spectra. The random-phase wave shown had the median peak factor of a set of 100 generated waves.

