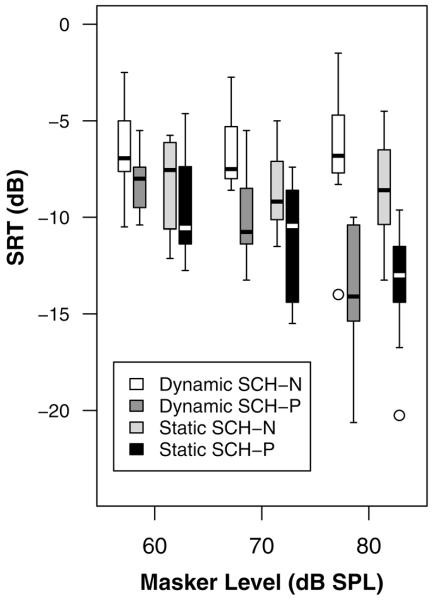
FIG. 3.
Box plots of SRTs for each combination of F0 type (dynamic or static) and phase relationship (Schroeder positive or Schroeder negative) for each of the three presentation levels in experiment 1. All maskers had components shaped according to the speech spectrum. The bar within each box shows the median, the extremes of the box show the first and third quartiles, whiskers extend to the most extreme data point no more than 1.5 times the interquartile range from the box, points outside that range are shown by open circles.

