Figure 1.
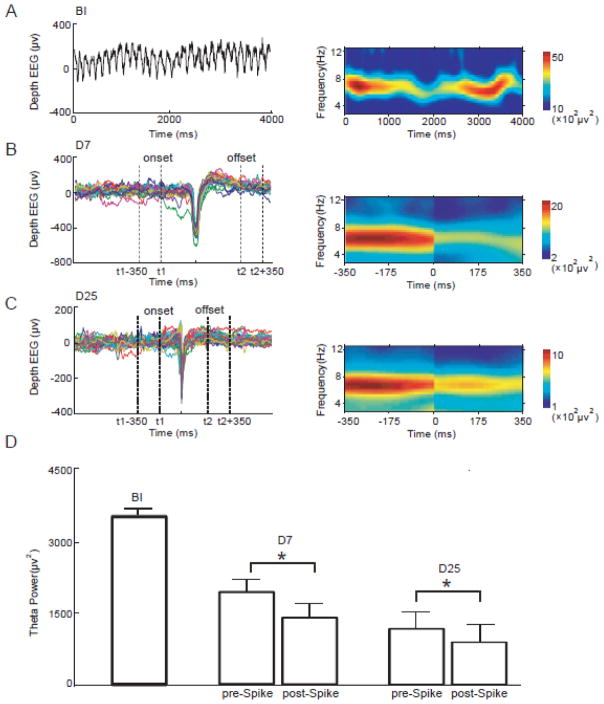
Theta power changes immediately after spikes. (A) An example segment of depth EEG recorded before-injection (left panel) and its power spectrum (right panel) are illustrated. (B) Spikes from the D7 group were aligned using the epochs sorting technology (left panel). The power spectra around spikes were shown in the right panel. In this example, the power spectra of epochs around 22 spikes from a single subject were averaged. Theta power significantly decreased after spikes. Note that spikes have been cut out in the time-frequency panel. (C) Artifact-free epochs around spikes in the D25 group (left panel) were subject to the time-frequency analysis and the power spectra were averaged. Theta power also decreased immediately after spikes. (D) Theta power of all epochs was compared. The pre-spike theta power persistently decreased from BI to D7 and then to D25. Theta power was significantly reduced after the spikes (paired t-test, p<0.05), both on D7 and D25.

