Figure 2.
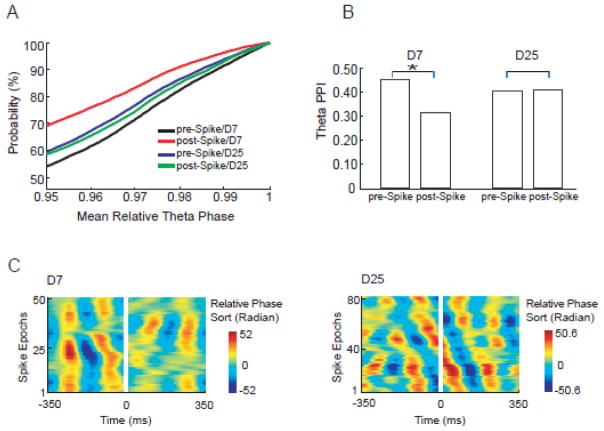
Theta phase stability changes around spikes are time dependent and differ between latent and chronic stages. Mean relative theta phase values were computed for all epochs and around multiple reference frequencies. Cumulative distribution functions (CDF) of mean relative theta phase value ≥ 0.95 were plotted for D7 and D25 groups (A). The CDF curves indicated that the highest probability of phase preservation appeared in the D7 pre-spike group (black curve). The phase stability measure, termed PPI, was plotted for both D7 and D25 groups. (B) On D7, the theta PPI demonstrated a 33% decrease from 0.46 pre-spike to 0.31 post-spike (bootstrapping, P<0.01). On D25, theta PPI demonstrated very little change (2.8% increase) after spikes (bootstrapping, P>0.95). (C) Time courses of theta phase stability around spikes (spikes were cut out). On D7 (51 epochs in total), theta phase stability decreased after spikes (stripes were dispersed after spikes, indicating more random phase). On D25 (83 epochs in total), no obvious theta phase stability change was seen after spikes (stripes did not change obviously after spikes).

