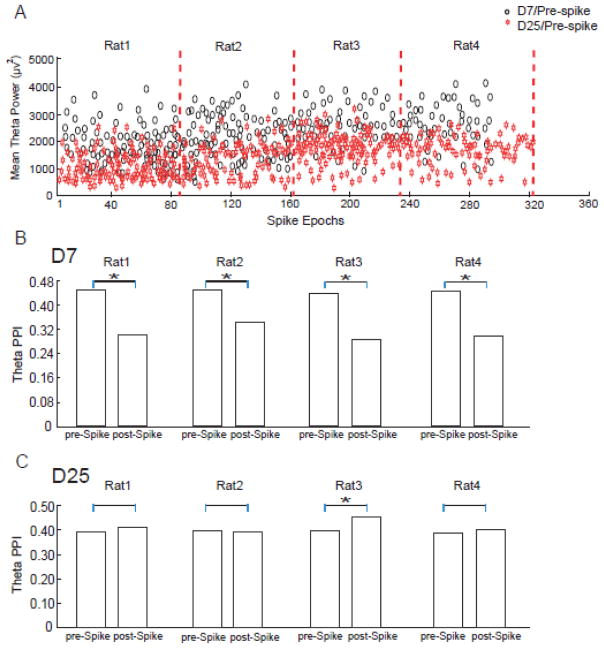
Figure 4.
Theta power and PPIs of individual subjects. (A) Pre-spike theta power of each individual subject. Theta power decreased from D7 to D25 in all rats (paired t-test, p<0.01). (B) Theta PPIs around spikes on D7 were calculated for each individual subject. Theta PPIs decreased after spikes in all subjects. (C) Theta PPIs after spikes on D25 were calculated for each individual subject. In all subjects, the change of theta PPIs after spikes showed different directionality between D25 and D7.

