Abstract
Self-healing polymeric materials are systems that after damage can revert to their original state with full or partial recovery of mechanical strength. Using scaling theory we study a simple model of autonomic self-healing of unentangled polymer networks. In this model one of the two end monomers of each polymer chain is fixed in space mimicking dangling chains attachment to a polymer network, while the sticky monomer at the other end of each chain can form pairwise reversible bond with the sticky end of another chain. We study the reaction kinetics of reversible bonds in this simple model and analyze the different stages in the self-repair process. The formation of bridges and the recovery of the material strength across the fractured interface during the healing period occur appreciably faster after shorter waiting time, during which the fractured surfaces are kept apart. We observe the slowest formation of bridges for self-adhesion after bringing into contact two bare surfaces with equilibrium (very low) density of open stickers in comparison with self-healing. The primary role of anomalous diffusion in material self-repair for short waiting times is established, while at long waiting times the recovery of bonds across fractured interface is due to hopping diffusion of stickers between different bonded partners. Acceleration in bridge formation for self-healing compared to self-adhesion is due to excess non-equilibrium concentration of open stickers. Full recovery of reversible bonds across fractured interface (formation of bridges) occurs after appreciably longer time than the equilibration time of the concentration of reversible bonds in the bulk.
Keywords: Self-healing, polymer networks, reversible, scaling theory
1. Introduction
The development of self-healing polymeric materials1–9 is inspired by biological systems where damage initiates an autonomous healing process without external intervention. Self-healing polymeric materials are defined as systems that after damage can revert to their original state with full or partial recovery of mechanical strength. These materials can be categorized into stimuli-induced and autonomic classes. Examples of self-healing based on stimuli-induced formation of bonds10–18 include reactions induced by heat treatment19–21 or irradiation22, 23.
The key feature of autonomic self-healing is that material repairs by itself without external intervention. The structure repair is accomplished through either healing agents embedded into a polymer matrix or the formation of reversible bonds. The concept of embedded healing agents was developed by Dry and collaborators24 in 1990’s and later extended by White et al.25 In this approach, chemicals are encapsulated and embedded into polymer matrix, while catalyst is dispersed in the polymer outside the capsules. Upon damage, the capsules are ruptured by propagating cracks, resulting in the release of the chemicals into the cracks. Subsequent reaction between the chemicals with the aid of the dispersed catalyst heals the material. Typical types of capsules are micro-hollow-particles,24–27 hollow fibers,28–31 and three dimensional vascular networks.32, 33 There are also two physical approaches to autonomic self-healing. One is to use encapsulated solvent, which facilitates local polymer chain mobility and thus results in the formation of entanglements across a crack.34, 35 Another approach is to use nano-particles that migrate through a composite material to a crack and impede its growth.36–38
Parallel to the development of embedded healing agents for hard thermosets a significant progress has been made for elastomers and gels. Contrarily to thermosets, elastomers and gels function above their glass transition temperature Tg and healing of elastomers is facilitated by chain segments of high mobility and by possibilities of achieving fast reversible associations or chemical reactions at ambient conditions. It was reported for example that fractured surfaces of elastomers heal autonomically for elastomers near the gel point.39 This effect was explained by the formation of entanglements between dangling chains across the interface. Networks with non-covalent associations,40–47 such as multiplets in ionomers, associations due to metal-ligand coordination, or hydrogen bonds, have been shown to have self-healing properties. Quite often, however, a thermal, optical or pH triggers have to be used to achieve self-healing. A typical example are materials based on reversible ionic associations, e.g., poly(ethylene-co-methacrylic acid) copolymer.40–43 Such ionomer films are not autonomic self-healing systems since their self-repair is achieved after projectile puncture. The penetration of these films by a projectile causes localized heating near the puncture and thus the ionomer material heals as a result of multiplet formation at higher temperatures in the melt state.40, 41 Both experimental48 and simulation works43 are conducted to understand the self-healing mechanism of ionomers. Interestingly, the same type of reversible associations can be used to make materials with autonomic or triggered self-healing properties. For example, metal-ligand coordinated supramolecular polymer melts required optical trigger to repair,46 but covalently cross-linked gels containing metal coordinative cross-links were self-healing when damaged without the need of an additional trigger.44
Recently, self-healing systems based on dynamic covalent chemistry have been developed.16, 17, 19, 49–55 High glass transition temperature systems on Diels-Alder reactions require thermal trigger to self-heal,19,50 whereas low Tg self-healing systems often behave like viscoelastic melts.16 Similarly systems employing degenerative disulfide exchanges2, 3 are viscoelastic, and so are those involving radical reshufflings of trithiocarbonates56 or metathesis exchange reactions.4, 57
An entirely different type of autonomic self-healing system based on reversible hydrogen bonds was reported by Leibler’s group.45, 58–65 It consisted of branched oligomers equipped with large number of supramolecular self-complementary and complementary functional groups. During damage, supramolecular rather than covalent bonds break and this creates a very non-equilibrium situation near fractured surfaces. Indeed, the concept relies on the fact that the concentration of dissociated groups near a freshly fractured surface is much higher than the equilibrium concentration. These dissociated groups tend to associate, forming bridges and thus repair damage. The principle of design relies on the high density of associating (bonding groups) and on long-lived associations and branched structure to achieve a very long mechanical relaxation time. Remarkably, the local concentration of dissociated groups remains high even after significant waiting time. When two fractured surfaces are brought into contact, the reversible associations (bridges) between these groups are formed across the interface, resulting in the self-repair of the sample. It is important to stress that self-repair was observed only across fractured surfaces, while other surfaces remain non-sticky because of very low equilibrium concentration of dissociated groups. Although this amazing discovery initiated active experimental search for materials with even better self-healing properties, the progress is hindered by the lack of molecular theory. The theory should answer the key question: how can the local concentration of dissociated groups and their lifetime be increased during the waiting period, while keeping a high rate of bond formation during the healing period and a low equilibrium concentration of disassociated groups away from fractured surfaces. Thus, there is a need for a microscopic theory that could provide a qualitative explanation of the difference between self-healing and self-adhesion. In the present paper we propose a simple theory of self-healing polymer network modeled by chains fixed in space at one end and with reversible pairwise associating stickers at the other end.
The rest of the manuscript is organized as follows. The model is described in Section 2. Section 3 focuses on the scaling theory for the equilibration kinetics of reversible polymer networks. Subsection 3.1 discusses the equilibrium state in polymer networks with reversible bonding. Subsection 3.2 introduces the relevant time scales determining the binding and bond scission events, as well as the time scales characterizing diffusion-controlled equilibration process and defines the stress relaxation time in a reversible polymer network. The kinetics of equilibration process from a state with high number density of open stickers is described in Section 4. In this section two regimes are identified: 1) anomalous diffusion regime and 2) hopping diffusion of open stickers. Based on the results of Section 4, we discuss the kinetics of self-adhesion and self-healing in Sections 5 and 6, respectively. Concluding remarks are presented in Section 7. A list of symbols is at the end of the paper and the simulation results of self-healing reversible polymer networks are presented and discussed in the Appendix.
2. Minimal model of self-healing hybrid networks: Reversible bonds formed by dangling chains of a permanent network
Our simple model (Figure 1) consists of chemically cross-linked (small black circles) polymers (grey lines) that form a permanent network well above the gel point. A large number of dangling chains (black lines) is attached to this network.66 The volume fraction of dangling chains is taken to be higher than that of the network. The dangling chains carry associating groups (stickers, large green and red circles) at free ends.
Figure 1.

Polymer network capable of autonomous self-repair. (a) The ends of dangling chains (black lines) carry groups (green and red circles) that form reversible pairwise associations. (b) After the material is broken there are many reactive groups (red circles) near the fractured surfaces. Significant fraction of these groups survives after extensive waiting time. (c) Many bonds (blue pairs of circles) are formed across the interface as the two fractured surfaces are brought into contact. Thin grey lines represent permanently cross-linked strands of the polymer network.
We assume that stickers can associate with each other by forming pairwise reversible bonds (green pairs of circles in Figure 1). The protocol for “ideal” fracture and healing consists of three stages:
A fracture surface is introduced in the polymer network (Figure 1b) and all the bridges that have attachment points on the opposite sides of this surface are cut at the reversible bonds. This cutting process creates an excess of open stickers (above the equilibrium concentration) in the vicinity (within the chain size) of the cut. Please note that cutting also breaks some covalent bonds in the permanent network. These bonds are not repaired during healing process.
The two parts of the sample are kept apart (Figure 1b). The local density of open stickers of the fractured sample decreases with time as loops are formed by some of the dangling chains with open stickers created by the cut.
After a certain waiting time, τw, the two parts of the sample are brought together and a healing process begins (Figure 1c). This healing process consists of the formation of bridges that link the cut networks together.
Self-healing is different from self-adhesion where two equilibrated surfaces are brought in contact. In self-adhesion the number of bridges across the interface grows slowly because of low concentrations of open stickers at unfractured (equilibrated) surfaces. However, cutting a sample creates a situation very far from equilibrium since many pairs of linked stickers are separated.
In the following we quantify the difference between bridge formations in cases far from equilibrium (healing process) and close to equilibrium (self-adhesion process). The maximum strength of the interface after a very long self-healing or self-adhesion should be the same but weaker than the bulk strength, because of the lack of permanent network bridges through the healed interface.
3. Kinetics of bond formation and breaking in reversible polymer networks
3.1 Bond equilibrium and concentration of open stickers
If the equilibrium between open (A) and closed, i.e., paired (A2), states of stickers is established
| (1) |
the equilibrium number density of open stickers is the function of the bond strength ε, and the total concentration of sticky groups ct = ceq(A) + 2ceq(A2). Considering the detailed balance in equilibrium between the species A and A2 one obtains the relation between the equilibrium concentrations of open and closed stickers:
| (2) |
in which
| (3) |
is the equilibrium constant for the reaction (1). Here the coefficient
| (4) |
is related to the change of the entropy upon formation of a dimer from a pair of open stickers and b is the molecular size. Solving eq. (2) one obtains the equilibrium number density of open stickers
| (5) |
In our minimal model the total concentration ct of sticky groups is one per volume of a dangling chain with N monomers of size b:
| (6) |
If the bond is weak, ε ≪ kBT ln N (equilibrium constant Keq ≪ 1/ct), most of the stickers are open ( , eq. (5)) and thus associations between stickers are not important. We therefore limit our consideration to the case of relatively strong associations with bond strength ε > kBT ln N. In this case the total sticker concentration satisfies ctKeq ≫ 1, and therefore, the equilibrium number density of open stickers (eq. (5)) is low ( ) and can be approximated as
| (7) |
Note that the “effective energy” of an open sticker is ε/2 (see eq. (7)) because two stickers form one bond with energy ε. Also note that concentration of open stickers is proportional to the square root of the total concentration of stickers ct since the bond formation can be described by the pairwise association reaction (eq. (1)).
The bond strength ε and the dangling chain length N determine the number density of open stickers as well as the average distance between them at equilibrium. Clearly if the bond strength ε is high the open stickers are far apart and two open stickers cannot easily recombine without reorganization of reversible network because their fluctuations in space are limited to the volume pervaded by a dangling chain near the anchoring point. The pervaded volume of a dangling chain with N monomers of size b is about:
| (8) |
From eq. (7) one can define a crossover bond strength at which there is one open sticker per pervaded volume of a chain:
| (9) |
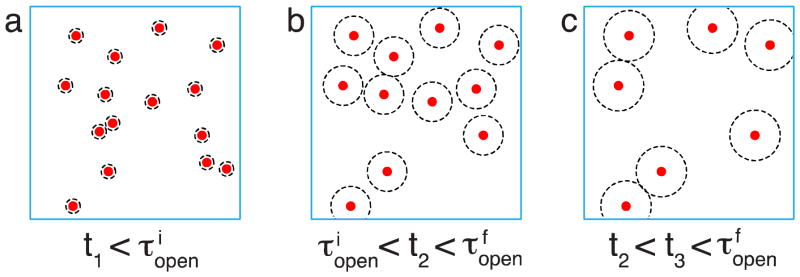
Thus, two situations have to be distinguished. The first one is for the intermediate bond strength ln N < ε/kBT < 2 ln N, in which there are many open stickers in the volume pervaded by a dangling chain (Figure 2a). The dynamics of bonding in this case is controlled by anomalous sub-diffusive Rouse motion of stickers. In the opposite case of high bond strength ε/kBT > 2 ln N (Figure 2b) the open stickers are far apart and more complex processes, called hopping (partner exchange), are required for two open stickers to recombine (see Section 4.2)
Figure 2.
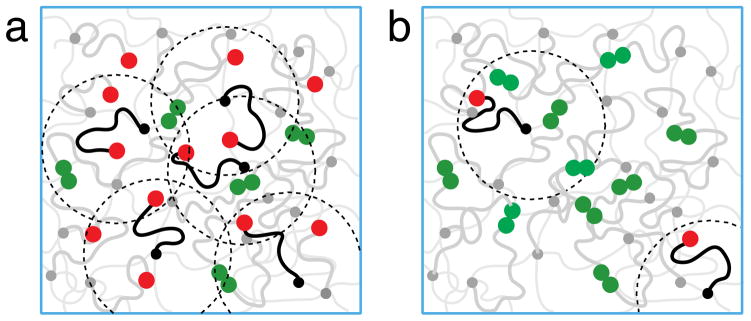
Schematic representation of the polymer network. The end monomers of dangling chains are sticky. (a) For intermediate bond strength kBT ln N < ε < 2kBT ln N there are many open stickers (red circles) in the volumes (shown as dotted circles) pervaded by dangling chains. For clarity only several dangling chains with open stickers (red circles) are depicted by black lines with the rest of dangling chains with open (red) and closed (green) stickers shown by grey lines. (b) For high bond strength ε > 2kBT ln N there is on average less than one open sticker in the pervaded volume (depicted by red circles at the ends of black dangling chains). The closed stickers at the ends of dangling chains (sketched by grey lines) are shown by green circles. The dim thin grey lines represent permanently cross-linked network strands.
3.2 Lifetime of an open sticker and renormalized bond lifetime
Let us look at the fate of a pair of stickers that are bound at time t = 0. They attempt to separate but only a small fraction of the attempts is successful because the stickers are in a potential well with energy ε. We call τb the average time two stickers spend in a bonded state before a successful separation on molecular distance, monomer length, b. This time scale increases exponentially with the bond strength
| (10) |
with τ0 being the time it takes for a monomer to diffuse the molecular distance b in the absence of any attraction between stickers. Here τ0 depends on the monomeric friction coefficient, which is related to the difference between sample temperature T and the glass transition temperature Tg.
If the attempt to separate is successful, each open sticker moves by Rouse sub-diffusive motion because it is connected to a dangling chain.67 The mean-square displacement of a monomer 〈Δ2(t)〉 increases as the square root of time t (instead of linear with time for a Brownian diffusion)
| (11) |
where
| (12) |
is the Rouse time of the dangling chain. For the segmental dynamics of Rouse chains in three dimensions the volume explored by an open sticker grows slower than linear with time t
| (13) |
This sub-diffusive process belongs to the class of compact space exploration68 due to multiple returns of the sticker to the same elementary volume b3. The number of returns to the same elementary volume can be estimated as the ratio of the total number of elementary steps, t/τ0, to the number of elementary volumes, Vexpl(t)/b3, “explored” during time t. Because the space exploration is a compact one, most excursions end up by two stickers encountering each other and forming a bond again.
When we look at a given sticker, most of the time it is bonded to another sticker. Most of the bond-breaking events are short-lived because the sticker again forms the bond with the same partner after a very short walk. Still there are very rare excursions of open stickers that are very long. These long excursions dominate the average lifetime in an open, non-linked state. More precisely, the average time the sticker is open is the time of anomalous diffusion over average distance ropen between neighboring open stickers:
| (14) |
This average lifetime of open stickers is estimated from eqs. (11) and (14):
| (15) |
For stress relaxation and other dynamic processes the important time is the time it takes a sticker to recombine with a new partner instead of returning to the old one. We define renormalized bond lifetime as the average time from the first formation of a bond between a particular pair of partners until the formation of a bond with a new open partner. This time is the sum of the total time J(τopen)τb two stickers stay bonded during J(τopen) multiple returns (or multiple close times) of average duration τb each and the time τopen they diffuse to a new sticker:
| (16) |
To calculate the average number of returns J to the old partner before bonding to a new one we have to consider a compact trajectory of an open sticker with respect to its partner. For a Rouse compact exploration, the mean square displacement of a sticker with respect to its partner is proportional to square root of the number of steps of size b (see eq. (11)):
| (17) |
The average number of returns to the old partner during a walk of n steps is equal to
| (18) |
where 〈Δr2〉3/2/b3 is the average number of sites in the explored volume. Hence the average number of returns at time τopen is J(τopen) ≈ ropen/b (eq. (17)) and the renormalized bond lifetime (eq. (16)) equals to
| (19) |
This scaling relation (eq. (19)) can be rewritten in terms of the equilibrium concentration of open stickers at higher bond strength ε > kBT ln N (see eq. (7)) using
| (20) |
with the total concentration of stickers ct ≈ 1/(b3N) and with α ≈ b3. In this case most of the stickers are bonded to each other and the renormalized bond lifetime is dominated by multiple close times
| (21) |
Thus, the interesting situation corresponds to the intermediate bond strength kBT ln N < ε < 2kBT ln N for which τopen is smaller than J(τopen)τb and the new sticker can be reached by Rouse anomalous sub-diffusion (see Figure 2a). For ε > 2kBT ln N the average distance between open stickers is larger than end-to-end distance of dangling chains (see Figure 2b) and τb > τR ≈ τ0N2 (eqs. 9 and 11). It should be stressed that at equilibrium
| (22) |
which is consistent with the law of mass action.
Unlike the bare bond lifetime τb the renormalized bond lifetime for the intermediate bond strength kBT ln N < ε < 2kBT ln N depends on the total sticker concentration (see eq. (21)). The effective exponent for the dependence of the renormalized bond lifetime on the bond strength ε is also different from that for the bare bond lifetime τb (7/6 vs. 1; c.f. eq. (10) and eq. (21)).
4. Kinetics of equilibration for reversible bonds
In order to understand the self-healing phenomena, we need to describe the kinetics of the equilibration process from a state with high number density of open stickers. The equilibrium concentration of open stickers depends on the value of bond strength ε for a given degree of polymerization N of dangling chains. Below we describe the kinetics of free sticker recombination following a sudden change of a bond strength (called energy (ε)-jump) from low εi to high value of εf. Note that three situations can occur:
In both initial εi and final εj states there are a lot of open stickers in the volume spanned by a dangling chain, i.e., the concentration of open stickers in the final state , in which corresponds to one open sticker per pervaded volume of a chain with size R0 ≈ bN1/2(see eq. (9)).
In the initial state with bond energy εi there are many open stickers in the volume of a dangling chain (see Figure 2a) but near the final state εj hopping process is necessary for equilibration (see Figure 2b), i.e., the concentration of open stickers in the initial state exceeds , while the concentration of open stickers in the final state is smaller than crossover concentration .
Recombination in both initial and final state requires hopping to equilibrate the system (see Figure 2b).
In the regimes described in items (2) and (3) the kinetics are controlled by the combination of chain dynamics and thermally activated de-bonding which slows down the equilibration process.
4.1 Anomalous diffusion regime
Let us consider the situation of an ε-jump with (equivalent to jump from temperature Ti to Tf < Ti). The excess of open stickers decreases with time as the system evolves towards equilibrium. The particular feature of compact diffusion is that after time t each open sticker visits each elementary volume b3 within exploration volume Vexpl(t) (see eq. (13)) many (on average J(t)) times. Therefore it would recombine with any open sticker present within this volume. This implies that all excess stickers have recombined and the remaining ones are at distance from each other on the order of the radius of the exploration volume (see dotted circles for the case of in Figure 3). The effect of randomness of locations of these volumes is discussed in Appendix AII (see Figure A2).
Figure 3.
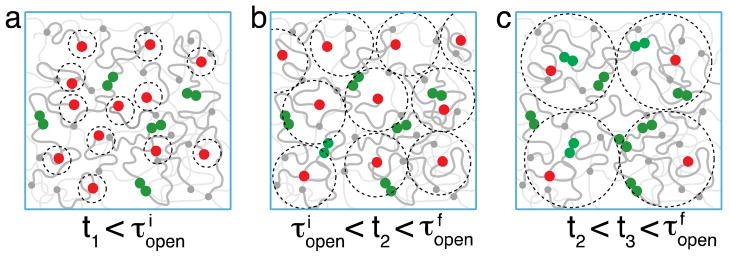
Anomalous diffusion regime for bond formation following an energy (ε)-jump up from a state with higher concentration of open stickers to a state with lower concentration of open stickers . The red circles are anomalously diffusing open stickers that form bonds, shown as pairs of green circles as soon as their exploration volumes (depicted as dotted circles) overlap. The transient “snapshots” of open stickers in the polymer network are shown at different times t, while (eq. (24)) and (eq. (25)) denote the open sticker lifetimes for initial and final equilibrium states. The grey lines represent dangling chains. The dim thin grey lines depict chemically cross-linked network chains.
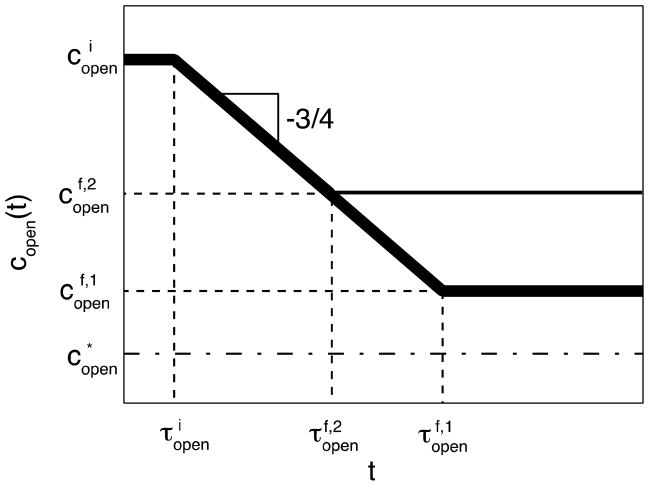
Thus, at time t the concentration of open stickers is (Figure 4, thick line)
Figure 4.
Relaxation of open sticker concentration copen(t) in the anomalous diffusion regime of bond formation in hybrid polymer network (thick lines) following an energy (ε)-jump up of the bond strength from the state with high initial concentration of open stickers to the states with lower final concentrations of open stickers still above . The thin line corresponds to equilibration at higher final concentration of open stickers and takes shorter time to equilibrate. Logarithmic axes.
| (23) |
where corresponds to the time at which the exploration volumes (eq. (13)) of initial open stickers start to overlap: , which gives
| (24) |
Once copen(t) reaches the system equilibrates. The equilibration time τeq for anomalous diffusion regime corresponds to open sticker lifetime in the state with final equilibrium concentration of open stickers (see eq. (15)).
| (25) |
Using eq. (7) we obtain the scaling relation for equilibration time τeq in the anomalous diffusion regime as function of chain length N and bond strength ε
| (26) |
It is important to stress that in practice there will be two crossover regimes: one at short times (see eq. (24)) and the other near the equilibration time τeq in the anomalous diffusion regime (see eq. (25)). Equation (27) below gives a convenient interpolation formula from initial condition through the power law dependence (eq. (23)) to the final concentration at t ≫ τeq (eq. (26))
| (27) |
This prediction has been verified by our hybrid molecular dynamics – Monte Carlo simulation (see Appendix A.II and Figure A1) from which the adjustable parameter C = 3.2 ± 0.1 was determined.
4.2 Hopping diffusion of open stickers: partner exchange regime
For short dangling chains and/or high bond strength the equilibrium concentration of open stickers can be smaller than one sticker per pervaded volume of the chain ( ). In this case open stickers cannot bond by anomalous diffusion. We expect that another mechanism, which we call hopping, or partner exchange, governs the mobility of open stickers (see Figure 5) at time scales longer than the Rouse time of a dangling chain.
Figure 5.
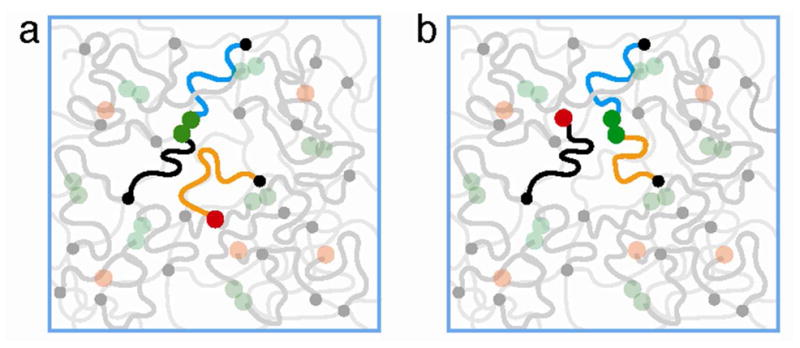
Effective diffusion of open stickers by the partner exchange process. The open sticker at the end of dangling orange chain “waits” until there is a broken pair of stickers within its exploration volume and binds with one of them (at the end of blue chain), while the remaining partner (at the end of black chain) of the former pair becomes the new open sticker (red circle) but with a shifted center of fluctuations.
Below we show that in the partner exchange regime the dynamics of open stickers at time scales t > τR can be described as the non-compact Brownian-like diffusion with the effective diffusion coefficient for hopping
| (28) |
The hopping event corresponds to a displacement of an open sticker over the distance comparable to the chain size R0 and the hopping time is expected to be proportional to the bare bond lifetime τb as explained below. Indeed, the number of potential partners for “exchange” reactions is equal to the number of bonded pairs in the volume and thus is proportional to N1/2. For a given bonded pair, in order to explore the volume and thus be able to exchange one of its stickers with the open sticker, N2 steps of size b during temporary separation are required (see eq. (13)). During these N2 steps the two stickers will recombine J ≈ (N2)1/4 = N1/2 times (see eq. (18)). As a result the exchange time with the given pair takes an average time N1/2τb. Thus, it takes on average time (N1/2τb)/N1/2, i.e., τb, for an open sticker to exchange with any of N1/2 potential candidates.
Consider the concentration of open stickers copen(t) at time t after the ε -jump. This concentration is on the order of one open sticker per exploration volume copen(t) ≈ 1/Vexpl(t), as for the anomalous diffusion regime (see eq. (23)). But in the case of hopping diffusion the volume explored by an open sticker Vexpl(t) grows linearly with time (non-compact space exploration) on time scale longer than partner exchange time τb.
| (29) |
Therefore, the concentration of open stickers decreases with time as
| (30) |
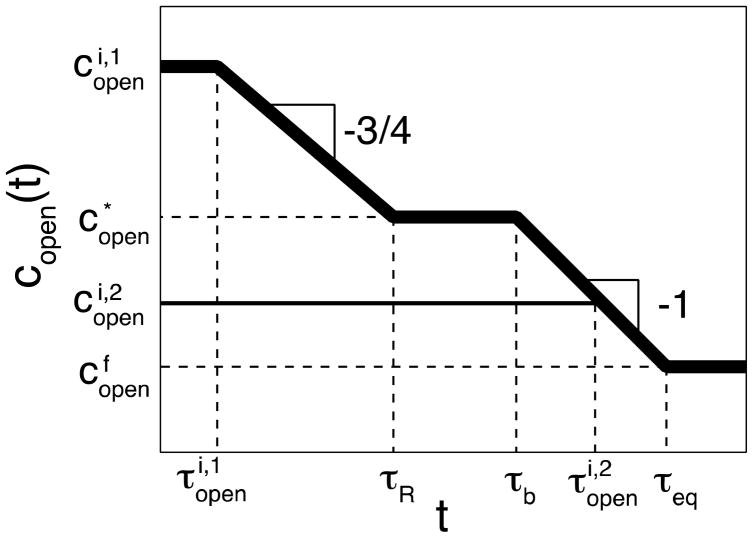
until equilibration of open sticker concentration (see the last segment of the thick line in Figure 6) that occurs at equilibration time τeq for high bond strength
Figure 6.
Kinetic regimes for bond formation in reversible polymer network following an increase of bond strength. Thick line: from the state with relatively high initial to low final concentrations of open stickers ; thin line: from the state with relatively low initial concentration of open stickers to the state with even lower final concentration of open stickers . The equilibration from initial concentration of open stickers to the final concentration of open stickers corresponds to the formation of bonds in the mixed regime (thick line): for t < τR by anomalous diffusion while at longer times t > τb the remaining bonds form in the partner exchange regime. Logarithmic axes.
| (31) |
If the initial concentration of open stickers exceeds while the final concentration is smaller than crossover density , we expect the two regimes of bond formation (anomalous diffusion and partner exchange) separated by a plateau (τR < t < τb) with the transient concentration of open stickers , shown by the thick line in Figure 6. The plateau exists because the open stickers cannot easily recombine by anomalous diffusion anymore and almost no open stickers are available for the partner exchanges within the plateau regime (second plateau at in Figure 6).
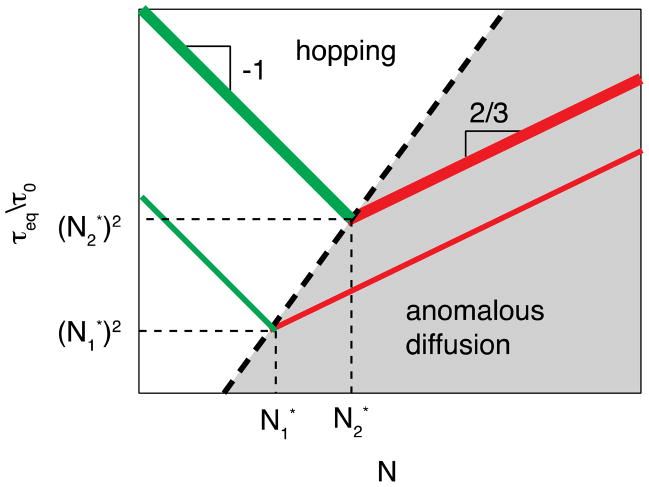
The scaling relations for τeq in anomalous diffusion and partner exchange regimes (eqs. (26) and (31)) predict the non-monotonic dependence of equilibration time on the chain length N for a given bond strength ε, shown in Figure 7. The equilibration of the system with short dangling chains requires partner exchanges, while for long chains the equilibrium is reached by anomalous diffusion. The equilibration time τeq in the partner exchange regime decreases with the chain length N while in the anomalous diffusion regime it increases as chains become longer. The equilibration time τeq in each regime is on the order of open sticker lifetime at equilibrium. The average distance between open stickers scales with the number of monomers N in dangling chains as . The equilibration time, τeq, in the anomalous diffusion regime increases with the average distance ropen < R0 between open stickers (at equilibrium) as (see Figure 7), where N* is the crossover degree of polymerization. The equilibration time τeq in the partner exchange regime ropen > R0 is inversely proportional to the effective diffusion coefficient for hopping (see eq. (28)), since the volume per open sticker (see eq. (20)) and effective “capture” radius R0 for hopping have the same N1/2 chain length dependences. Thus, the hopping motion of open stickers in the polymer network slows down as dangling chains become shorter. There is a crossover between these two kinetic regimes that corresponds to N* ≈ exp[ε/(2kBT)] with the shortest open sticker equilibration time τeq (see Figure 7).
Figure 7.
Equilibration time τeq for the open sticker concentration in the polymer network with reversible bonding as a function of chain length N for two different bond strength ε1 and ε2 (ε1 < ε2). and are the two crossover chain lengths corresponding to different bond strength ε1 and ε2. The scaling relation between the crossover chain length and the bond strength N* ≈ exp[ε/(2kBT)] is shown by the dashed line. The hybrid network equilibrates within anomalous diffusion regime for longer chains N > N* (red lines) with equilibration time τeq increasing with N. For shorter chains N < N* (green lines) equilibration is in the hopping regime with equilibration time τeq of open stickers decreasing with N. Logarithmic axes.
5. Kinetics of self-adhesion
We consider two equilibrated pieces of the material which are brought in contact at time t = 0. We assume that there is no excess of open or closed stickers at their surfaces and that the contact is perfect. Reorganization of reversible bonds will lead to adhesion of the two pieces to each other. By adhesion here we mean formation of bridges across the contact interface. Of course at the end of the process of bridge formation the interface will be weaker than the bulk because we do not recreate permanent links across the interface. The surface density of bridges at equilibrium for relatively high bond strength is
| (32) |
As discussed in Section 4, depending on the strength of reversible bonds and the length of the dangling chains two situations have to be distinguished. We start the discussion with the case of very strong bonds ε > 2kBT ln N, for which the equilibrium concentration of open stickers is below the overlap value, , and the average distance between them is larger than the dangling chain size R0. In such a case new bond formation requires reorganization of temporary network because two dangling stickers are too far to recombine directly.
Free sticker diffusion is possible by the hopping mechanism as described in Section 4.2. Hence, for bridge formation two processes can be envisaged.
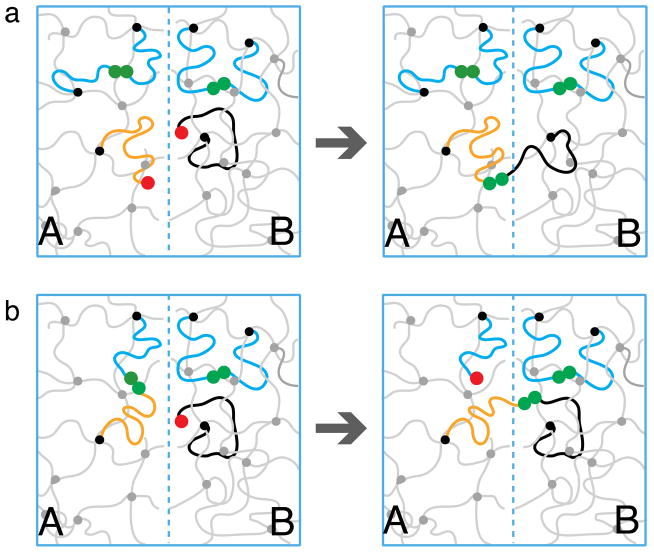
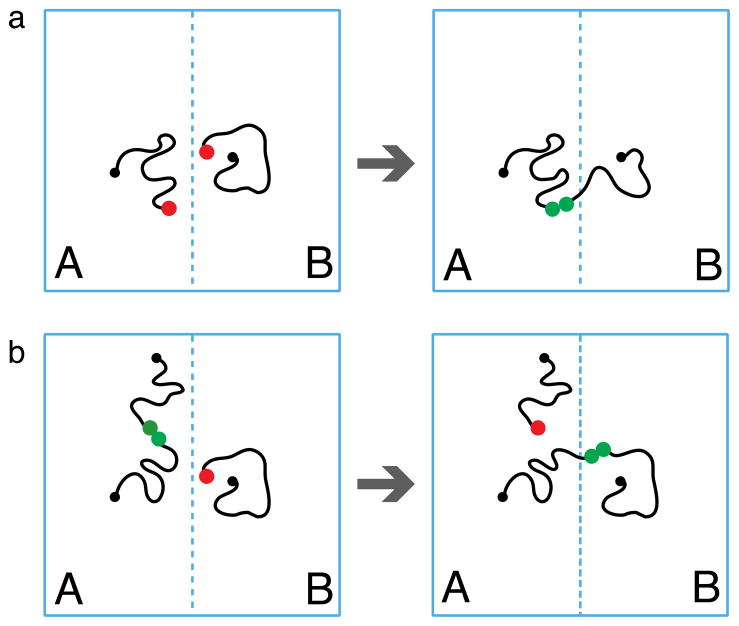
To form a bridge a sticker that is attached to network A has to diffuse across the interface and bind to a free sticker linked to network B. The sticker to which it binds could be an open sticker that is far from any other open stickers in sample B and we call this process direct bonding, shown in Figure 8a. The probability of finding such a sticker is small ( ) because the bond energy is high.
The more frequent event is for free sticker to bond to a sticker which has just left a partner for a very short excursion as discussed in Section 4.2. We call this event partner exchange. As illustrated in Figure 8b, the partner exchange is optimal for bridge formation because not only a bridge across the interface is formed but the resulted new open sticker is close to the interface and can readily form another bond by crossing the interface back from B to A. We call this bridging mechanism – stitching process.
Figure 8.
Formation of bridges at low concentration of open stickers . (a) Direct bonding of two open stickers (red circles) across the interface. (b) An open sticker (depicted by a red circle) hops across the interface (from black to blue chain) by partner exchange, converting a loop into a bridge, while keeping the number of open stickers unchanged.
5.1 Direct Bonding
For short adhesion times t < τR the direct recombination process dominates because hopping diffusion requires longer time steps. The time dependence of bridge formation process can be described by
| (33) |
where Vexpl(t) (see eq. (13)) is the exploration volume of an open sticker by anomalous diffusion and is the thickness of the interface layer from which an open sticker can reach the opposite side of the interface during time t. Vexpl(t)copen is the probability of finding an open sticker for recombination. Using eqs. (4), (9), (10), and (13) one can rewrite eq. (33) as
| (34) |
The surface density of bridges formed by direct recombination process saturates at Rouse time τR and is equal to
| (35) |
This value is much smaller than the equilibrium surface density of bridges (see eq. (32)) and even smaller than because .
5.2 Stitching Process
For times longer than the Rouse time τR, the number of bridges saturates at the value σb(τR) (eq. (35)) until the time at which partner exchange mechanism becomes effective. The surface density of bridges formed by partner exchange process is given by
| (36) |
where W(t) is the width of the layer from which open stickers can cross the interface during time t by the hopping process with diffusion coefficient (see eq. (28)):
| (37) |
and n(t) in eq. (36) is the average number of times an open sticker within this zone crosses the interface. It is essential to stress that almost every time an open sticker crosses the interface it builds a bridge (see Figure 8b). In this process, called “stitching”, the identity of the open stickers changes (see Figure 8b with an open sticker on a black chain becoming an open sticker on a blue chain). The number of crossings n(t) can be obtained by considering the transient diffusion of open stickers in the direction perpendicular to the interface, which is effectively a one-dimensional random walk. Therefore, the number of crossings equals to the square root of the total number of steps:
| (38) |
Hence, the surface density of bridges formed by partner exchanges grows linearly with time
| (39) |
where τeq (see eq. (31)) is the bulk equilibration time after an excess of open stickers has been created and corresponds to the equilibrium concentration of open stickers (eq. (30))
| (40) |
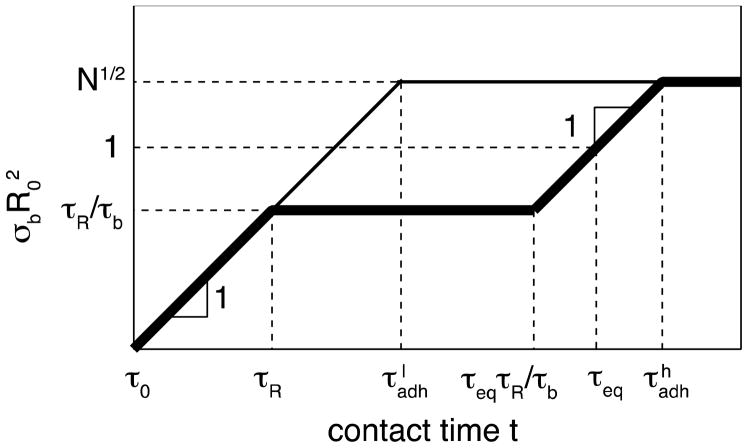
Note that the partner exchange dominates over the direct bonding at times t > τRτeq/τb – see the end of thick plateau in Figure 9.
Figure 9.
Bond formation in self-adhesion with high (εh > 2kBT ln N; thick line) and intermediate (kBT ln N < εl < 2kBT ln N; thin line) bond strength. Both axes are logarithmic.
The linear time dependence of σb (eq. (39)) suggests a simple interpretation: in the hopping regime the number of bridges formed is given by the flux due to diffusion of open stickers by hopping across the interface. Indeed, the flux of open stickers per unit area per unit time is:
| (41) |
Figure 9 summarizes both direct bonding and stitching regimes. In practice, to get a significant density of bridges (a bridge per area ) one needs to wait time on the order of τeq (eq. (31)). As shown by the last sections of the thick line in Figure 9, the truly equilibrated interface for the case of high bond strength ε > 2kBT ln N is formed after an even longer time
| (42) |
5.3 Self-adhesion by anomalous diffusion for intermediate bond energies
In the situation of smaller binding energies ε < 2kBT ln N the direct recombination plays a more important role. The surface density of bridges is given by eq. (33) and increases linearly with time up to adhesion time τadh (see eq. (34))
| (43) |
and then saturates at (see eq. (32) and thin line in Figure 9). The adhesion time at which the interface is fully reconstructed for intermediate bond strength is
| (44) |
We should stress that the linear time dependence of σb(t) is obtained for t < τopen despite the fact that the recombination involves anomalous diffusion. In general the exploration volume Vexpl(t) ∝ t3/dw, where dw is walk dimension of the open sticker trajectory. Hence, in general the surface density of bridges is (see eq. (33))
| (45) |
For the anomalous Rouse diffusion dw = 4 and therefore we get σb(t) ∝ t. For adhesion times longer than τopen (see eq. (15)) the bonds form and break with the rate per unit area starting with diffusion time of open stickers τopen corresponding to average distance between open stickers. This will also be the rate of bridge formation due to detailed balance between bond breaking and bond formation in equilibrium. Please note that for t < τopen and t > τopen the bridge formation rate is the same, though the mechanisms are quite different.
6. Kinetics of self-healing
Cutting networks with reversible bonds creates many open stickers in the cut surface layers of each piece, and therefore, creates a situation far from equilibrium. When the healing process is not initiated immediately, but only after some waiting time τw, both pieces tend to partially equilibrate the open sticker concentration by forming loops. This process of decrease of number of open stickers is analogous to that discussed for energy-jump in Section 4 except that it occurs only in the layers adjacent to the cut surface.
6.1. Decrease of excess open stickers with waiting time
The initial local concentration of open stickers in the interface zone within distance R0 of the fresh cut is proportional to the total concentration of stickers: . Chains in this layer could be initially strongly deformed and the rates of associations during the first waiting stage (t < τR) may depend on this deformation. For simplicity, we ignore this complication.
For times shorter than the Rouse time τR of dangling chains, the anomalous diffusion of stickers at the ends of dangling chains governs the disappearance of open stickers in the near-cut surface layers. The “onset” time for anomalous diffusion regime at which the exploration volumes of the open stickers start to overlap is (see eq. (24)):
| (46) |
Hence, for , the decrease of the excess number of open stickers per unit area in the fractured layers, σopen(τw), is analogous to that described by eq. (23):
| (47) |
where Vexpl(τw) is the volume explored by an open sticker at waiting time τw by the anomalous Rouse diffusion (see eq. (13)) as depicted in Figure 10.
Figure 10.
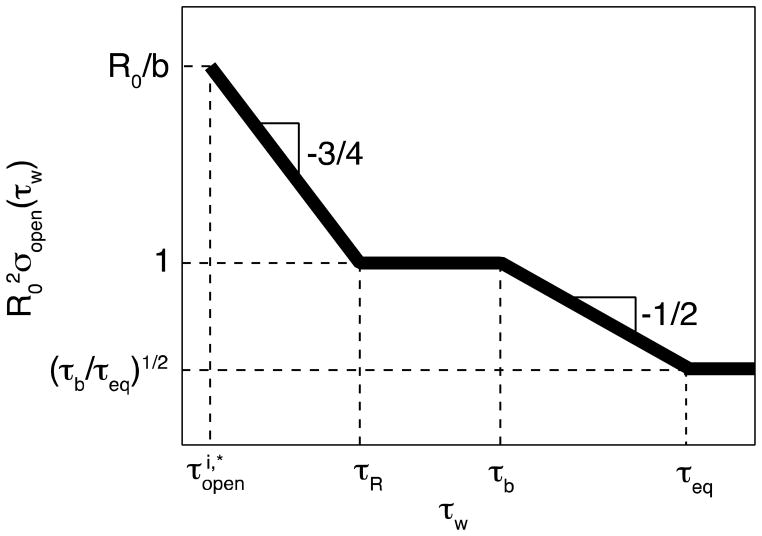
Decrease of the surface number density of open stickers near the cut surface during the waiting period for high bond strength ε > 2kBT ln N. Both axes are logarithmic.
Associations between open stickers during waiting time τR < τw < τb slow down since there are no available partners easily reachable by the remaining open stickers. This plateau level is reached at the end of anomalous diffusion regime τw ≈ τR and corresponds to one open sticker per chain area (see eq. (9)) as shown by the horizontal line in Figure 10.
For times τw > τb the hopping recombination becomes possible and the number of excess open stickers will further decrease. However, it should be stressed that the open stickers diffuse further away from the cut surfaces into the bulk of the samples. Therefore, the concentration of open stickers in the surface layer decreases due to both recombination and diffusion away from the surface layers. The later process leads to the widening of the surface layer, which contains excess of open stickers. We account for this by introducing a time-dependent layer containing excess of open stickers. The width of this layer increases with waiting time τw (see eq. (37))
| (48) |
since open stickers diffuse out of the initial “cut” zone of width R0 by the hopping with the diffusion coefficient DH given by eq. (28). The decrease of the number density of open stickers per unit area during this stage of the waiting regime is
| (49) |
where is the volume explored by hopping diffusion during waiting period τw (see eq. (29)).
Figure 10 summarizes the decrease of excess surface number density of open stickers σopen with waiting time τw. Note, however, the reciprocal square root time dependence of σopen(τw) in eq. (49) instead of reciprocal time dependence of copen(τw) in eq. (30) in partner exchange regime due to the widening of the surface layer width W(τw) with excess open sticker concentration (see eq. (48)).
6.2. Formation of bridges
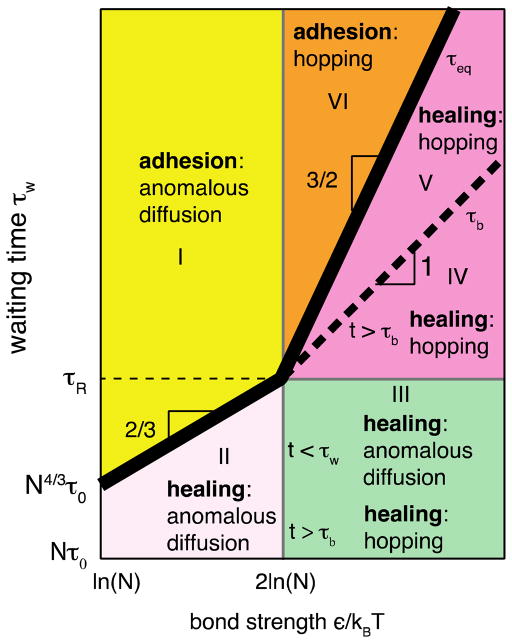
We discuss below how the excess of open stickers remaining after some waiting time controls the healing efficiency. Indeed, the presence of the excess open stickers near the surface makes healing more efficient than self-adhesion of equilibrated samples. Still, microscopic mechanisms described for self-adhesion—direct recombination and stitching partner exchange—operate as well. In particular, the situations for intermediate and strong binding have to be distinguished and different regimes are shown in Figure 11. In addition, the healing and adhesion processes are distinguished by the extent of waiting time. If the waiting time, τw, is larger than the equilibration time of excess open stickers, τeq, the repair process is called self-adhesion. The thick line in Figure 11 separates adhesion and healing repair regimes.
Figure 11.
The diagram of kinetic regimes for healing processes depending on the waiting time τw after cut and bond strength ε, which determines the equilibrium number density of open stickers (see eq. (9)). The thick solid line represents the bulk equilibration time τeq as function of bond strength (eq. (26) for kBT ln N < ε < 2kBT ln N and eq. (31) for ε > 2kBT ln N), whereas the dashed line corresponds to the bond lifetime τb as a function the bond strength (eq. (10)). Thin solid lines correspond to the boundaries between different regimes. Vertical axis is logarithmic while the horizontal axis is linear.
Intermediate binding energy
For intermediate binding energies kBT ln N < ε < 2kBT ln N the equilibration time τeq separating healing and adhesion is τopen (eqs. (15) and (26)). In this case with long waiting time τw > τeq, shown by regime I in Figure 11, the formation of bridges proceeds by adhesion process. The building of bridges by anomalous diffusion of open stickers in self-adhesion was discussed in detail in Section 5.
For short waiting time τw < τeq the healing regime (regime II in Figure 11) dominated by anomalous diffusion of open stickers, in which the initial rate of bridge formation is high. Indeed, in analogy with eq. (33), we have
| (50) |
in which copen(τw) ≈ 1/Vexpl(τw) (see eq. (23)) corresponds to the concentration of excess open stickers left after waiting time τw. Therefore using eq. (23) for copen(τw) and for Vexpl(t) we can rewrite eq. (50) as
| (51) |
This linear increase of surface density of bridges slows down at healing time of about τw. This is because at such time scale the concentration of open stickers in the surface layer starts to effectively decrease towards equilibrium value due to the formation of loops.
The recombination of open stickers due to loop formation occurs in the whole surface layer that is thicker than the actual layer in which bridges can be formed. This results in the decrease of the rate of bridge formation not only because the quantity of open stickers is lower, but also because most stickers form loops before they have a chance to reach the interface. Hence, after healing time t of about τw the number of bridges reaches the plateau value of about
| (52) |
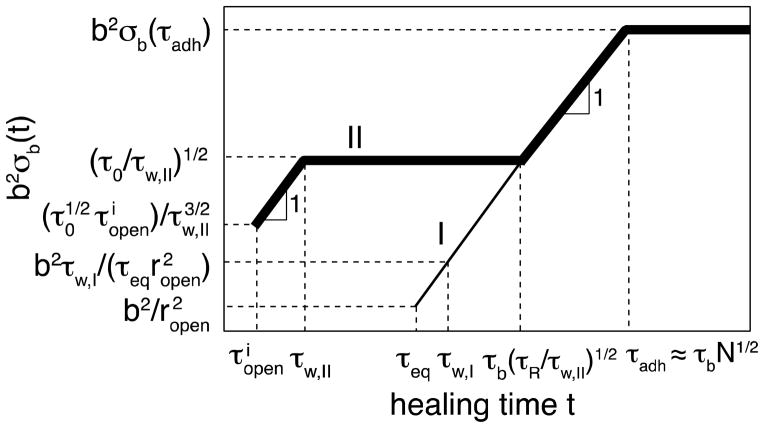
and only few additional bridges are formed up to the healing time τeq ≈ τopen, at which point the concentration of open stickers in the surface layer reaches its equilibrium value (see the plateau in Figure 12).
Figure 12.
The recovery of the surface density of bridges with intermediate binding energy kBT ln N < ε < 2kBT ln N for self-healing process corresponding to regime II in Figure 11 (τw < τeq < τR) is shown by thick line. The self-healing after long waiting time (τw > τeq) corresponding to regime I in Figure 11 is similar to self-adhesion and depicted by thin line. Both axes are logarithmic.
Actually some bridges are still formed at times between τw and τeq due to rare open stickers reaching the interface from places further away from the interface without recombining with other open stickers from the same side of the interface (loop formation). The rate of bridge formation in this time regime is 1/[tVexpl2/3(t)]. The surface density of bridges formed during this interval t > τw thus will slowly increase with time as
| (53) |
We propose a convenient interpolation formula that covers the whole time range
| (54) |
Still, at healing times t ≈ τeq the surface density of bridges σb(t = τeq) is smaller than σb(t = τadh), meaning that the stucture of the interface is not completely equilibrated. The bridge formation at times longer than τeq proceeds by exactly the same process as we discussed for self-adhesion (see eq. (43) and thin line in Figure 9), as shown by the third section of the thick line in Figure 12 that coincides with the thin line corresponding to self-adhesion (regime I).
High Binding Energy
For high binding energy ε > 2kBT ln N the dependence of healing performance on waiting time τw is more involved.
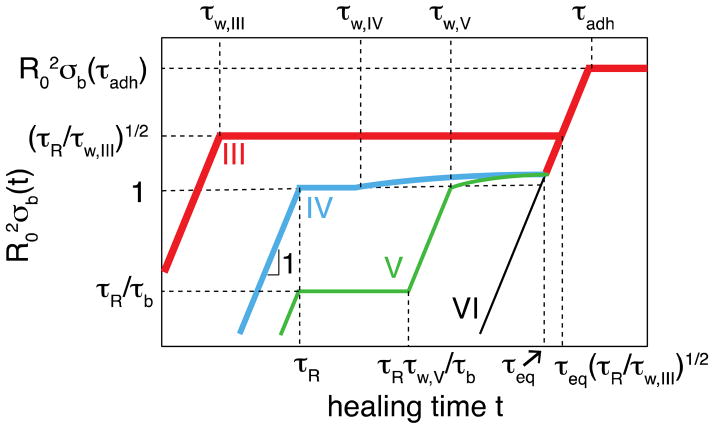
For short waiting time τw < τR (regime III in Figure 11), initial concentration of open stickers is above (see eq. (9)), which is much higher than the equilibrium value. The process of bridge formation during initial healing stage is controlled by anomalous diffusion similar to regime II – see red line in Figure 13. At short time scales (t < τw) the formation of bridges is dominated by anomalous diffusion (eq. (51)), whereas at longer times scales (τw < t < τR) it slows down due to the formation of loops (eqs (53)).
Figure 13.
Kinetics of bridge formation in self-healing with high binding energy ε > 2kBT ln N. The thickest red line – regime III in Figure 11 with short waiting time τw,III < τR; thick blue line – regime IV in Figure 11 with intermediate waiting time τR < τw,IV < τb; green intermediate-thick line – regime V in Figure 11 with long waiting time τb < τw,V < τeq. Self-adhesion processes with extremely long waiting time τw < τeq (regime VI in Figure 11) is depicted by thin black line. The relevant times scales and kinetic regimes are explained in the text. Both axes are logarithmic.
| (55) |
At healing times (t > τb) longer than Rouse time τR additional bridge formation is contributed from partner exchange process and has the same kinetics as that for self-adhesion (eq. (39) and the third section of the thick line in Figure 9) – see red line in Figure 13
| (56) |
Note that in this case the partner exchange process starts to dominate at later times than in self-adhesion, as the significant fraction of bridges are recovered by the anomalous diffusion at early stages of healing (eq. (55)).
For waiting time τR < τw < τb the initial concentration of open stickers in the surface layer is (regime IV in Figure 11). In this case the initial healing process is controlled by anomalous diffusion (eq. (51) with τw replaced by τR)
| (57) |
and saturates at Rouse time, τR, at the surface density of bridges (see blue line in Figure 13). The rest of bridge formation proceeds by partner exchange process similar to that for regime V that will be described below.
In the case of longer waiting time τb < τw < τeq (regime V in Figure 11) the initial concentration of stickers in the surface layer is below , but still it is higher than ceq. For healing times shorter than τw (t < τw) the bridge formation obeys the same law as for adhesion (see eqs. (33) – (35), and (39)), but with (eq. (59)) instead of copen as the current “quasi-equilibrium” concentration of open stickers. The self-healing process, sketched by the green line in Figure 13, follows direct bonding process (eqs. (33) – (34) at short times, saturates at Rouse time at (eq. (35)), and then proceeds by stitching process (eq. (39))
| (58) |
where we’ve used the expression for the concentration of open stickers at the end of waiting regime (see eq. (30))
| (59) |
Next we consider the healing process in regimes IV and V with long healing time exceeding the partner exchange time (t > τb) and also longer than the waiting time (t > τw) (see blue and green lines in Figure 13). The concentration of open stickers in the surface layer σopen(t) decreases due to both their recombination and diffusion of excess open stickers towards the bulk. The surface density of excess open stickers decreases with time following the t−1/2 law (eq. (49)). Such a decrease slows down bridge formation. The rate of bridge formation is
| (60) |
where dn/dt is the average rate of hops of a given sticker across the interface that leads to bridge formation
| (61) |
just as discussed for the self-adhesion process (Section 5). Hence,
| (62) |
The surface density of formed bridges is proportional to the product of the time dependent density of open stickers per unit area and the number of times each open stickers hops across the interface and forms a bridge. Integrating eq. (62) one obtains the logarithmic increase of the surface number density of bridges with healing time t in this regime (see slowly increasing blue and green lines in Figure 13)
| (63) |
This logarithmically slow increase of the surface number density of bridges (eq. (63)) is because at long time scales the density of open stickers near the interfaces becomes very low. To form additional bridges, stickers far from the interface have to migrate towards the interface through a relatively slow hopping diffusion. At very long time scales the concentration of excess open stickers decays to the equilibrium value and the additional bridge formation proceeds by self-adhesion-like partner exchange process (see eqs. (39) and (57); the last sections of blue and green curves in Figure 13).
If waiting time τw is longer than τeq (regime VI in Figure 11) the concentration of open stickers near fractured surfaces equilibrates and bridge formation proceeds at the same rate as for the self-adhesion case (see Section 5 and thin black line in Figure 13).
Here we briefly summarize the results for kinetics of self-healing. The mechanisms of bridge formation across the interface between two fractured surfaces of the material involve different regimes depending on the waiting time τw before they are brought into contact. For waiting times shorter than equilibration time τeq of open sticker concentration in the bulk, the acceleration in bridge formation for self-healing compared to self-adhesion is due to excess non-equilibrium concentration of open stickers near the fractured surface. For waiting times shorter than the longest relaxation time of a dangling chain (regimes II and III in Figure 11), the excess of open stickers near the fractured surfaces is higher than the crossover concentration (one open sticker per pervaded volume of a dangling chain). The bridge formation first proceeds through the anomalous diffusion and then (for regime III in Figure 11) through the partner exchange process (line II in Figure 12 and line III in Figure 13). If the waiting time is longer than the Rouse time of a dangling chain, the excess of open stickers near the fractured surfaces is lower than the crossover concentration . The bridge formation in this case is contributed by multiple partner exchanges – the stitching mechanism (regimes IV and V in Figure 11 – see blue and green lines IV and V in Figure 13). For very long waiting times at which the system is equilibrated, the healing process between the two fractured surfaces is similar to that for self-adhesion (regimes I and VI in Figure 11 and lines I in Figure 12 and VI in Figure 13).
7. Conclusions
We develop scaling theory of the self-healing process in hybrid reversible/permanent polymer networks. The hybrid network is modeled by a system consisting of dangling chains with reversible stickers at one end attached to a permanently cross-linked network at the other end. These stickers can form reversible bonds with each other enabling self-healing process. We introduced different time scales to characterize the lifetime of an open sticker in the hybrid networks. We demonstrate that the renormalized bond lifetime for a reversible bond to break and for one of the resultant open stickers to find a new partner is much longer that the bare bond lifetime due to multiple returns of newly-formed open stickers to their old “partners”. The renormalized bond lifetime determined by the partner exchange process is the relevant time scale for description of the stress relaxation in reversible networks. The anomalous diffusion and partner exchange kinetic regimes are identified as the relaxation processes in the bulk system after bond strength energy (ε)-jumps.
We analyze two different stages of the self-repair process for two damaged surfaces with initial excess of open stickers: 1) during waiting period while the broken parts of the material are kept apart from each other; 2) the kinetics of bridge formation after two broken pieces of the sample are brought back into contact. The excess of open stickers near the fractured surfaces decays with waiting time by recombination of these open stickers initially through their anomalous diffusion and later by hopping diffusion process (partner exchange between pairs of stickers). If the waiting period is very long, the density of open stickers near the fractured surfaces is close to that of equilibrium value. Under this situation, the recovery process of two fractured surfaces is similar to that of two equilibrated (un-damaged) surfaces, and therefore, termed self-adhesion. The self-healing process applies to the relatively short waiting period at which most open stickers have not yet found their partners. Therefore, there is still considerable amount of open stickers near the fractured surfaces at the moment they are brought into contact. Some of these open stickers that are in close proximity of fractured surfaces quickly form bridges across the interface through direct bonding (Figure 14a). After this quick process, the rate of bridge formation slows down and continues successively through bond partner exchange mechanism (Figure 14b). The full recovery of bridges will be reached at time τadh much longer than the equilibration time τeq of open sticker concentration.
Figure 14.
Formation of bridges (pairs of green circles) due to (a) direct bonding of two open stickers (red circles) across the interface; (b) hopping (partner exchange) of an open sticker (depicted by a red circle) across the interface by converting a loop into a bridge, while keeping the number of open stickers unchanged.
We should point out that the “long time-scales” for our modeled networks to equilibrate are still “very short” compared to those observed in experiments on self-healing supramolecular rubbers45. Other mechanisms such as connectivity of chains with associative groups combined with mesoscopic organization45, 58–63 could be of importance in affecting the rate of self-healing process. Yet, our model captures the molecular picture of self-healing reversible networks and sheds some light on the mechanism of self-healing process. We expect that our model can be extended to other self-healing materials with reversible bonds, such as mesoscopically organized or entangled polymers45, 58–63, as well as to reversible networks formed by ionic bonds40–47 such as in polyanion/polycation coacervates and in polyampholyte gels69.
NOTATIONS
| Symbols | Explanation | |
|---|---|---|
| b | Monomer size | |
| N | Number of monomers per dangling chain | |
| copen | Concentration (number density) of open stickers | |
| σopen | Number of open stickers per unit area in the fractured layers | |
|
|
Equilibrium concentration of open stickers, eqs. 22 and 40 | |
| ct | Total concentration of sticky groups | |
| ceq(A2) | Equilibrium concentration of pairs of sticky groups | |
|
|
Crossover concentration of open stickers | |
|
|
Initial concentration of open stickers | |
|
|
Final concentration of open stickers | |
| Keq | Equilibrium constant for reaction | |
| ε | Bond strength | |
| εi | Initial bond strength | |
| εf | Final bond strength | |
| τ0 | Monomer relaxation time | |
| τb | Bond lifetime, average time two stickers spend in a bonded sate before a successful separation on molecular distance, eq. 10 | |
| τR | Rouse relaxation time of a dangling chain | |
| τw | Waiting time before two fractured surfaces are brought into contact | |
| τopen | Average lifetime of open stickers, eq. 15 | |
|
|
Time at which the open stickers arrive final equilibrium concentration | |
|
|
Onset time for open stickers start to overlap, eqs. 24 and 46 | |
|
|
Renormalized bond lifetime, eq. 16 | |
| τadh | Adhesion time for high bond strength, eqs. 42 and 44 | |
| 〈Δr2〉 | Mean-square displacement, eqs. 11 and 17 | |
| ropen | Distance between neighboring open stickers, eq. 14 | |
| Vexpl | Exploration volume via anomalous diffusion, eqs. 13 and 29 | |
| J | Average number of returns, eq.18 | |
| DH | Hopping diffusion coefficient, eq. 28 | |
| N* | Crossover chain length between anomalous diffusion and hopping regimes | |
|
|
Surface density of bridges at equilibrium, eq. 32 | |
| σb | Surface density of bridges, eqs. 33, 34, 35, 36, 39, 43, 45, 50, 51, 53, 54, 55, 56,57, and 58 | |
|
|
Plateau density of bridges at the end of anomalous diffusion regime (at healing time t = τw), eq. 52 | |
|
|
Rate of bridge formation, eqs. 60 and 62 | |
| W | Width of the surface layer containing excess of open stickers, eqs. 37 and 48 | |
| n | Number of crossings across the interface, eq. 38 | |
|
|
Average rate of hops of a given sticker across the interface that leads to bridge formation, eq. 61 |
Acknowledgments
We thank Mathieu Capelot and Francois Tournilhac for discussions on self-healing and supramolecular systems.” L.L. and M.R. wish to thank Department of Chemistry, UNC and laboratory Matière Molle et Chimie, ESPCI, respectively, for hospitality during visits, which enabled major progress in the project. We would like to acknowledge the financial support of NSF CHE-0911588, DMR-0907515, DMR-1121107, DMR-1122483, and CBET-0609087, NIH R01HL077546 and P50HL107168, and Cystic Fibrosis Foundation under grant RUBIN09XX0.
Appendix: Comparison of Theory with Computer Simulations
Below we describe the hybrid molecular dynamics (MD) – Monte Carlo (MC) simulation method of a simplified model of dangling chains with reversible bonds at the ends and compare the simulation results with predictions of our scaling theory.
AI. Hybrid MD/MC simulation method
The simulation protocol is built on the framework of the Kremer-Grest bead-spring model of N-mers.70 We represent sticky dangling chains attached to a polymer network by effective chains fixed in space at one end and containing associating groups (stickers) at the other end. Stickers can form pairwise saturated reversible bonds with open partners – other stickers. Each dangling chain is a linear polymer containing N monomers. Systems consist of M chains, so the total number of monomers in a simulation box is M×N. Periodic boundary conditions are applied in all three directions. All monomers interact via the purely repulsive truncated and shifted Lennard-Jones (LJ) potential
| (A1) |
with the cut-off radius rc = 21/6σLJ. Bonds between adjacent monomers on a chain are modeled using the finitely extensible nonlinear elastic (FENE) potential,
| (A2) |
with RFENE = 1.5σLJ and .70 This choice of parameters gives an average bond length b0 ≈ 0.96σLJ corresponding to the minimum of the potential ULJ(r) + UFENE(r). We express all quantities in units of the LJ bead diameter σLJ, inter-monomer energy εLJ, and the LJ time,
| (A3) |
where m is the mass of a monomer. All systems have fixed monomer density and temperature in this study is T = 1.0εLJ/kB.
Sticky monomers are identical to regular monomers, except that they can form reversible bonds. If two sticky monomers are bonded, they interact via the “sticky bond” potential
| (A4) |
which is a modified form of the standard covalent FENE potential. The only difference between the sticky and covalent bond potentials is the constant offset UFENE(b0) + ε.71 The sticky bond potential USB describes the saturated pairwise interaction between sticky monomers, i.e. a given sticky monomer can form a bond with only one other sticky monomer at once. The distance-independent energy offset UFENE(b0) + ε (eq. A4) is used to control the fraction of close bonds in simulations.
Hybrid MD/MC simulations are performed with this model using an enhanced version of DL_POLY 2.12 software package.72 Newton’s equations of motion are integrated using the velocity Verlet method with a time step δtMD = 0.01τLJ. A Langevin thermostat73 is used to maintain the desired temperature with the damping time τLang = 10 τLJ. All spatial motion of particles proceeds following the molecular dynamics protocol. Formation and breaking of sticky bonds is performed using Metropolis Monte Carlo.74 At each MC step, we randomly select pairs of sticky monomers from all available pairs with the distance between sticky monomers less than RFENE. If a randomly selected pair is bonded, an attempt is made to break the bond using the Metropolis criterion. If the energy of the un-bonded state is lower than the energy of the bonded state (USB > 0) the bond is broken. If USB < 0, the bond is broken with probability exp[USB(r, ε)/kBT] and is not broken with probability 1 − exp[USB(r, ε)/kBT]. If the randomly selected pair is unbonded, the bond is formed using Metropolis criterion. If USB(r, ε) < 0 the bond is always formed and if USB(r, ε) > 0 the bond is formed with probability exp[−USB(r, ε)/kBT] and is not formed with probability 1 − exp[USB(r, ε)/kBT]. The process is repeated for all randomly selected pairs. A previously randomly selected pair (both reacted and unreacted) is not excluded from the list for future MC updates within the same MC cycle. (Note that in ref. 70 the previously selected pair is excluded from the list.) If one of the stickers of a randomly selected pair is bonded with another partner then the pair is left unmodified. Each pair is chosen with frequency ω = 1/τMC, where τMC is the time interval between two successive MC steps, i.e., on average a randomly selected pair is chosen once during each MC step. In our simulation, we use τMC = τLJ.71
The simulation protocol for the self-healing process consists of five steps:
Equilibration of the melt and dangling chain attachment. After the equilibration of the melt (density ) of M linear N-mers in a box with periodic boundary conditions, one end of each chain is fixed at its current location.
Equilibration of the reversible network. The free ends of all chains become sticky – they are allowed to form reversible bonds with energy ε (eq. A4) and the system is re-equilibrated.
-
Ideal cut. An “ideal cut” is introduced along the xy-plane through the middle of the simulation box (see Figure 1). The “ideal cut” breaks associations between the temporary bonded pairs of dangling chains, called bridges, which are attached at the opposite sides of the cut surface. Simultaneously the “ideal cut” pushes the dangling chains and loops to their respective halves using the confining potential along the z-direction, perpendicular to the plane of the cut
(A5) with −Lz/2 ≤ z ≤ Lz/2, where Lz is the size of the simulation box in z direction. During the “ideal cut” the MC updates for the whole system are not carried out.
Waiting period. After the “ideal cut” MC updates of sticky bonds are switched on, but during the waiting period no reversible bonds are allowed to form across this fracture plane and the confining potential (eq. A5) is kept on.
Healing period. After some waiting time, fractured sections are shifted with respect to each other by half of the simulation box length along the fracture plane in x-direction. MC updates for the whole system are switched off during this shift. After the shift, the confining potential is turned off, the MC updates of reversible bonds are switched on, and the chains are allowed to interpenetrate and to form sticky bonds (bridges) across the fractured interface.
The simulation results presented below are obtained by averaging the data for systems with M = 2000 dangling chains of N = 10 monomers and M = 1000 dangling dimers with N = 2 monomers over 60 trajectories starting from three different initial configurations of randomly anchored chains formed from an equilibrated melt.
AII. Bond formation in the anomalous diffusion regime
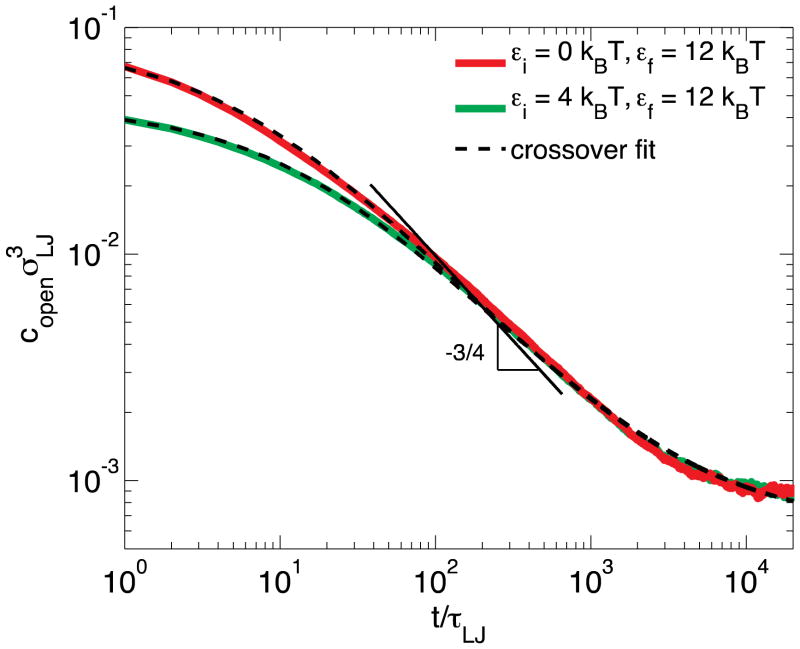
Figure A1 shows the simulation results for energy (ε)-jumps from two different initial states with bond energies εi = 0 (solid red line) and εi = 4kBT (solid green line) to the same final state with bond energy εf = 12kBT. The number of monomers per dangling chain is N = 10. The transient concentration of open stickers in the intermediate and later stages of equilibration is predicted by our scaling model to be independent of the initial concentration (see eq. (23)). This prediction is verified by our simulation; as shown in Figure A1, the time dependence of the concentration of open stickers copen can be fitted by eq. (27):
| (A6) |
The initial concentrations of open stickers are calculated based on the equilibrated systems before the energy jumps: for εi = 0kBT, ; for εi = 4kBT, . The two-parameter fit of eq. (A6) with the final concentration of open stickers and constant C = 3.2 ± 0.1 as fitting parameters (dashed lines in Figure A1) exhibits excellent agreement with simulation data (red and green lines).
One may estimate the value of the constant C by rewriting eq. (A6) in terms of exploration volume Vexpl
| (A7) |
in which A describes the fraction of the total volume of the system explored by unreacted open stickers. If A = 1, the unreacted open stickers explore all the volume of the system; whereas A < 1 indicates that the open stickers explore only part of the total volume and leave a fraction 1 − A of the volume unexplored (or explored by other stickers that formed bonds at earlier time and are no longer open).
The time dependence of the exploration volume is
| (A8) |
in which B = 0.3 as determined by separate simulations (not shown). From eqs. (A6), (A7), and (A8), one obtains the coefficient A = B/C ≈ 0.1, suggesting that only about 10% of the total system volume is explored by currently open stickers.
This low fraction of the explored volume can be understood by considering reactions between open stickers that are attached to dangling chains. Each open sticker can be effectively represented by a sphere growing with time and with radius determined by the anomalous diffusion of open stickers. Once two spheres touch, they are taken out of the consideration as they represent a reacted pair. The number of remaining “un-reacted” spheres decreases with time (with increasing radii r of spheres). The open stickers are randomly distributed in space, resulting in loose packing of the “currently unreacted” spheres (Figure A2). Therefore, the ratio A of the explored volume to the total volume is much smaller than unity. In fact, our simulations (not shown) give A ≈ 0.12 by counting the density of remaining spheres. This independently estimated value is in reasonable agreement with the value of 0.1 obtained above (see Figure A1).
AIII. Hopping regime of equilibration for short dangling chains
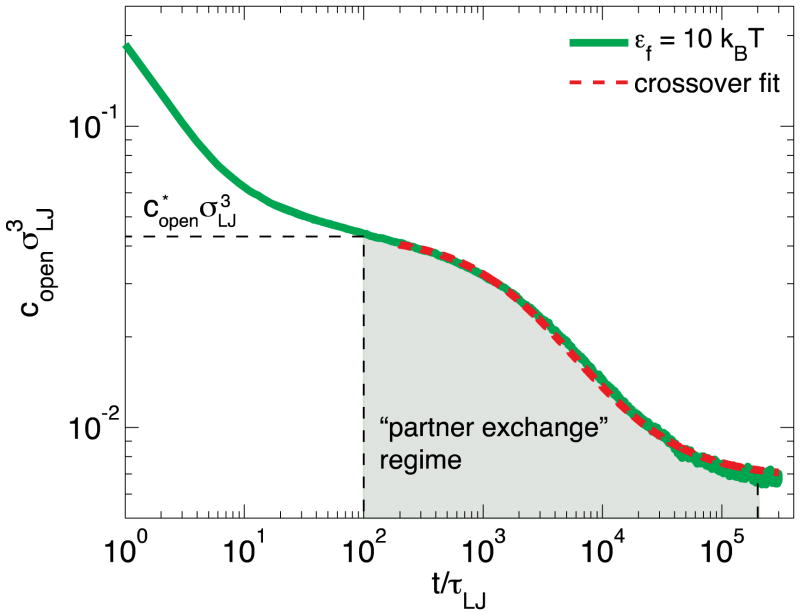
Simulation results for the bond equilibration between stickers at ends of short dangling chains (N = 2) following ε-jump from the initial state with no bonds (εi = 0) to the final state with strong bonds εf = 10kBT are presented in Figure A3. We identify two regimes of bond formation in this figure: (1) an early regime that does not involve the breakings of already formed bonds (for 0 < t/τLJ < 50); (2) the second regime (t/τLJ > 50) in which the recombination of the remaining open stickers requires the breaking of initially formed bonds and the successive hopping diffusion of open stickers between different bond partners (Figures 6 & A3).
This “partner exchange” regime starts around the crossover concentration of open stickers , at which there is one open sticker per pervaded volume of a dangling bond. In the “partner exchange” regime, the concentration of open stickers decays with time because the remaining open stickers diffuse to find each other by hopping. The transition of concentration of open stickers from to final equilibrated concentration can be described by an interpolation formula similar to eq. (27)
| (A9) |
in which the final concentration of open stickers is determined by the simulation data at long times t/τLJ > 2×10⁵. The effective rate constant for hopping and the crossover concentration of open stickers are determined by the fit of eq. (A9) to data in Figure A3 for t/τLJ > 100 (dashed red line). This value of can be rationalized by eq. (A7) using the values A=0.12 and resulting in in reasonable agreement with the fit value.
Since we have mapped the hopping process onto the diffusion-controlled bimolecular reaction between open stickers (non-compact space exploration in 3D) with capture radius for this reaction R0 equal to the size of dimers, we may rationalize the rate constant using the expression from Smoluchowski theory which in our case . Here, we used eq. (28) for DH and assumed that the scaling factor in it is equal to unity. The capture radius for dimers N = 2 is equal to average bond length R0 = 1 σLJ. The bare bond lifetime τb = 3200τLJ is determined from separate numerical simulation at ε = 10kBT (not shown). Using the values of these parameters one obtains the rate constant for hopping , which is close to the effective hopping rate constant obtained from the fit of eq. (A9) to our simulation data.
AIV. Bond equilibration during the waiting period
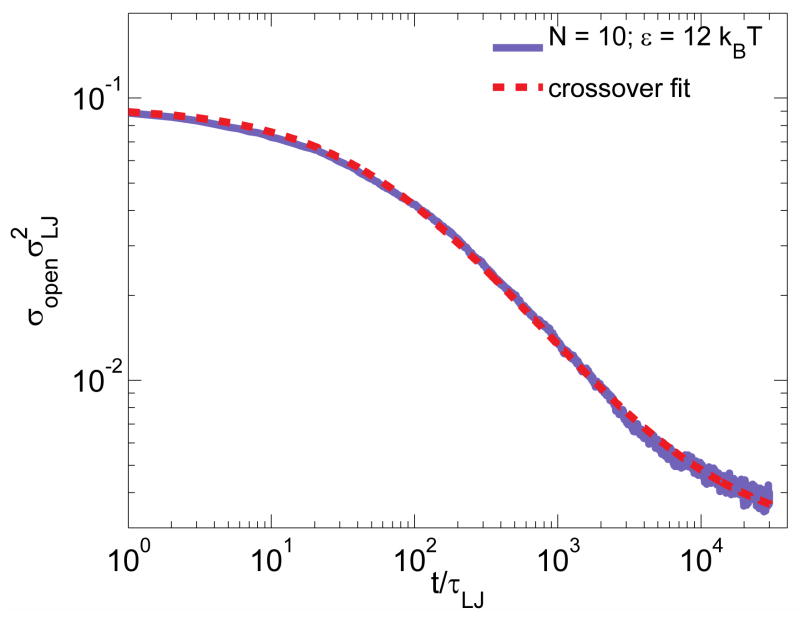
The time dependence of the number density of open stickers per unit area, σopen(t), during the waiting period after the cut is shown in Figure A4 for the dangling chains with N = 10 monomers. The number density of open stickers per unit area of the cut surface is defined as σopen = Nopen/L2, where L = 28.65σLJ is the size of simulation box, Nopen is the number of open stickers in the “cut zone” with the width that is equal to the end-to-end distance of dangling chains: w = R0 = 3.6σLJ for N = 10, which corresponds to the size of the reaction zone in the anomalous diffusion regime, and L2 is the area of the cut surface.
The time dependence for the number density of open stickers suggests that the excess open stickers associate within the anomalous diffusion regime. From eqs. (27) and (47) the decay of open stickers can be described by a crossover formula
| (A10) |
in which corresponds to the initial concentration of open stickers before direct bonding and is determined by our simulation data at time zero. Using eq. (A10) to fit the data in Figure A4 one obtains two fitting parameters: the final equilibrium surface density of open stickers and Cw = 1.6 ± 0.1. Note that this constant Cw compares favorably with C = 3.2 obtained from eq. (A6). The difference in values of parameters C and Cw obtained using eqs. (A6) and (A10) might be because our fitting did not take into account the fast initial decay of open stickers due to direct bonding.
Thus, our hybrid MD/MC simulation verifies some of our scaling predictions presented in this paper. More systematic computer simulations to test other predictions of the model are needed.
Figure A1.
Decay of the concentration of open stickers at the ends of dangling chains with N = 10 monomers following an ε-jump. The concentration of open stickers copen as a function of time t for equilibration of reversible polymer network from the states with no sticky bonds εi = 0 (red line), or with lower bond strength 4kBT (green line) to the state with higher bond strength at εf = 12kBT. The black dashed lines are fits using eq. (A6) with the same two adjustable parameters: the final concentration of open stickers and constant C = 3.2 ± 0.1 for both fits.
Figure A2.
Reaction between anomalously diffusing open stickers is modeled by growing effective spheres. (a) Initially the open stickers are not evenly distributed in space; (b) the exploration volume of open stickers increases with time and the size of the corresponding effective spheres grows. As spheres contact each other they are considered as pairs of stickers that form closed bonds and are removed from the consideration; (c) the actual exploration volume of remaining open stickers is much smaller than the total volume of the system (~10%).
Figure A3.
Time dependence of the concentration of open stickers at the ends of dangling anchored dimers equilibrating from the state with all open stickers at bond strength εi = 0 kBT (no bonds in this state) to the state with low concentrations of open stickers εf = 10kBT (green line). The dashed red line is the fit of the kinetic profile for εf = 10kBT by the crossover eq. (A9) in the hopping regime (t > 100τLJ). The fitting parameters are rate constant for hopping and crossover density of open stickers .
Figure A4.
Decrease of the surface density of open stickers during a waiting period. The time dependence of number density per unit area of open stickers in the “cut zone” with width R0 = 3.6σLJ after “ideal” cut for N = 10 and ε = 12 kBT (blue line). Red dashed line is the fit of eq. (A10) to the simulation data with two fitting parameters: the final equilibrium surface density of open stickers in the “cut zone” and CW = 1.6 ± 0.1.
References
- 1.Zwaag Svd, Schmets AJM, Zaken Gvd. Self healing materials: an alternative approach to 20 centuries of materials science. Springer; Dordrecht, The Netherlands: 2007. p. xii.p. 385. [Google Scholar]
- 2.Bergman SD, Wudl F. Journal of Materials Chemistry. 2008;18:41–62. [Google Scholar]
- 3.Wool RP. Soft Matter. 2008;4(3):400–418. doi: 10.1039/b711716g. [DOI] [PubMed] [Google Scholar]
- 4.Wu DY, Meure S, Solomon D. Progress in Polymer Science. 2008;33(5):479–522. [Google Scholar]
- 5.Williams KA, Dreyer DR, Bielawski CW. MRS Bulletin. 2008;33(8):759–765. [Google Scholar]
- 6.Blaiszik BJ, Kramer SLB, Olugebefola SC, Moore JS, Sottos NR, White SR. Annu Rev Mater Res. 2010;40:179–211. [Google Scholar]
- 7.Murphy EB, Wudl F. Progress in Polymer Science. 2010;35(1–2):223–251. [Google Scholar]
- 8.Syrett JA, Becer CR, Haddleton DM. Polymer Chemistry. 2010;1(7):978–987. [Google Scholar]
- 9.Burattini S, Greenland BW, Chappell D, Colquhoun HM, Hayes W. Chem Soc Rev. 2010;39(6):1973–1985. doi: 10.1039/b904502n. [DOI] [PubMed] [Google Scholar]
- 10.Jud K, Kausch HH. Polym Bull. 1979;1(10):697–707. [Google Scholar]
- 11.Kim YH, Wool RP. Macromolecules. 1983;16(7):1115–1120. [Google Scholar]
- 12.Lin CB, Lee SB, Liu KS. Polymer Engineering and Science. 1990;30(21):1399–1406. [Google Scholar]
- 13.Wool RP. Polymer interfaces: structure and strength. Hanser Publishers; New York: 1994. [Google Scholar]
- 14.Hsieh HC, Yang TJ, Lee S. Polymer. 2001;42(3):1227–1241. [Google Scholar]
- 15.Yang F, Pitchumani R. Macromolecules. 2002;35(8):3213–3224. [Google Scholar]
- 16.Reutenauer P, Buhler E, Boul PJ, Candau SJ, Lehn JM. Chemistry. 2009;15(8):1893–900. doi: 10.1002/chem.200802145. [DOI] [PubMed] [Google Scholar]
- 17.Deng GH, Tang CM, Li FY, Jiang HF, Chen YM. Macromolecules. 2010;43(3):1191–1194. [Google Scholar]
- 18.Imato K, Nishihara M, Kanehara T, Amamoto Y, Takahara A, Otsuka H. Angewandte Chemie International Edition. 2012;51(5):1138–1142. doi: 10.1002/anie.201104069. [DOI] [PubMed] [Google Scholar]
- 19.Chen XX, Dam MA, Ono K, Mal A, Shen HB, Nutt SR, Sheran K, Wudl F. Science. 2002;295(5560):1698–1702. doi: 10.1126/science.1065879. [DOI] [PubMed] [Google Scholar]
- 20.Liu YL, Hsieh CY, Chen YW. Polymer. 2006;47(8):2581–2586. [Google Scholar]
- 21.Klukovich HM, Kean ZS, Iacono ST, Craig SL. J Am Chem Soc. 2011;133(44):17882–17888. doi: 10.1021/ja2074517. [DOI] [PubMed] [Google Scholar]
- 22.Chung CM, Roh YS, Cho SY, Kim JG. Chemistry of Materials. 2004;16(21):3982–3984. [Google Scholar]
- 23.Ghosh B, Urban MW. Science. 2009;323(5920):1458–1460. doi: 10.1126/science.1167391. [DOI] [PubMed] [Google Scholar]
- 24.Dry C. Composite Structures. 1996;35(3):263–269. [Google Scholar]
- 25.White SR, Sottos NR, Geubelle PH, Moore JS, Kessler MR, Sriram SR, Brown EN, Viswanathan S. Nature. 2001;409(6822):794–797. doi: 10.1038/35057232. [DOI] [PubMed] [Google Scholar]
- 26.Brown EN, Kessler MR, Sottos NR, White SR. Journal of Microencapsulation. 2003;20(6):719–730. doi: 10.1080/0265204031000154160. [DOI] [PubMed] [Google Scholar]
- 27.Brown EN, White SR, Sottos NR. Composites Science and Technology. 2005;65(15–16):2466–2473. [Google Scholar]
- 28.Pang JWC, Bond IP. Composites Science and Technology. 2005;65(11–12):1791–1799. [Google Scholar]
- 29.Trask RS, Bond IP. Smart Materials and Structures. 2006;15(3):704–710. [Google Scholar]
- 30.Williams HR, Trask RS, Bond IP. Smart Materials and Structures. 2007;16(4):1198–1207. [Google Scholar]
- 31.Yin T, Zhou L, Rong MZ, Zhang MQ. Smart Materials and Structures. 2008;17(1):015019. [Google Scholar]
- 32.Hoveyda AH, Zhugralin AR. Nature. 2007;450(7167):243–251. doi: 10.1038/nature06351. [DOI] [PubMed] [Google Scholar]
- 33.Toohey KS, Sottos NR, Lewis JA, Moore JS, White SR. Nat Mater. 2007;6(8):581–585. doi: 10.1038/nmat1934. [DOI] [PubMed] [Google Scholar]
- 34.Caruso MM, Delafuente DA, Ho V, Sottos NR, Moore JS, White SR. Macromolecules. 2007;40(25):8830–8832. [Google Scholar]
- 35.Yuan YC, Rong MZ, Zhang MQ, Chen B, Yang GC, Li XM. Macromolecules. 2008;41(14):5197–5202. [Google Scholar]
- 36.Lee JY, Buxton GA, Balazs AC. J Chem Phys. 2004;121(11):5531–5540. doi: 10.1063/1.1784432. [DOI] [PubMed] [Google Scholar]
- 37.Smith KA, Tyagi S, Balazs AC. Macromolecules. 2005;38(24):10138–10147. [Google Scholar]
- 38.Balazs AC. Mater Today. 2007;10(9):18–23. [Google Scholar]
- 39.Yamaguchi M, Ono S, Terano M. Mater Lett. 2007;61(6):1396–1399. [Google Scholar]
- 40.Fall R. Puncture reversal of ethylene ionomers - mechanics studies. Master of Science, Virginia Polytechnic Institute and State University; Blacksburg, Va: 2001. [Google Scholar]
- 41.Kalista SJ. Self-healing of thermoplastic poly(ethylene-co-methacrylic acid) copolymers following projectile puncture. Master of Science, Virginia Polytechnic Institute and State University; Blacksburg, Va: 2003. [Google Scholar]
- 42.Varley RJ. Ionomers as self-healing polymers. Springer Series in Materials Science. 2007;100:95–114. [Google Scholar]
- 43.Dirama TE, Varshney V, Anderson KL, Shumaker JA, Johnson JA. Mechanics of Time Dependent Materials. 2008;12(3):205–220. [Google Scholar]
- 44.Kersey FR, Loveless DM, Craig SL. Journal of the Royal Society Interface. 2007;4(13):373–380. doi: 10.1098/rsif.2006.0187. [DOI] [PMC free article] [PubMed] [Google Scholar]
- 45.Cordier P, Tournilhac F, Soulie-Ziakovic C, Leibler L. Nature. 2008;451(7181):977–980. doi: 10.1038/nature06669. [DOI] [PubMed] [Google Scholar]
- 46.Burnworth M, Tang LM, Kumpfer JR, Duncan AJ, Beyer FL, Fiore GL, Rowan SJ, Weder C. Nature. 2011;472(7343):334–U230. doi: 10.1038/nature09963. [DOI] [PubMed] [Google Scholar]
- 47.Burattini S, Greenland BW, Merino DH, Weng W, Seppala J, Colquhoun HM, Hayes W, Mackay ME, Hamley IW, Rowan SJ. J Am Chem Soc. 2010;132(34):12051–8. doi: 10.1021/ja104446r. [DOI] [PubMed] [Google Scholar]
- 48.Varley RJ, Zwaag Svd. Polym Test. 2008;27(1):11–19. [Google Scholar]
- 49.Muller AHE. Macromol Rapid Comm. 2005;26(24):1893–1894. [Google Scholar]
- 50.Adzima BJ, Kloxin CJ, Bowman CN. Adv Mater. 2010;22(25):2784–2787. doi: 10.1002/adma.200904138. [DOI] [PubMed] [Google Scholar]
- 51.Canadell J, Goossens H, Klumperman B. Macromolecules. 2011;44(8):2536–2541. [Google Scholar]
- 52.Fairbanks BD, Singh SP, Bowman CN, Anseth KS. Macromolecules. 2011;44(8):2444–2450. doi: 10.1021/ma200202w. [DOI] [PMC free article] [PubMed] [Google Scholar]
- 53.Montarnal D, Capelot M, Tournilhac F, Leibler L. Science. 2011;334(6058):965–968. doi: 10.1126/science.1212648. [DOI] [PubMed] [Google Scholar]
- 54.Capelot M, Unterlass MM, Tournilhac F, Leibler L. Acs Macro Lett. 2012;1(7):789–792. doi: 10.1021/mz300239f. [DOI] [PubMed] [Google Scholar]
- 55.Lu YX, Tournilhac F, Leibler L, Guan ZB. J Am Chem Soc. 2012;134(20):8424–8427. doi: 10.1021/ja303356z. [DOI] [PubMed] [Google Scholar]
- 56.Nicolay R, Kamada J, Van Wassen A, Matyjaszewski K. Macromolecules. 2010;43(9):4355–4361. [Google Scholar]
- 57.Lu YX, Guan ZB. J Am Chem Soc. 2012;134(34):14226–14231. doi: 10.1021/ja306287s. [DOI] [PubMed] [Google Scholar]
- 58.Montarnal D, Cordier P, Soulié-Ziakovic C, Tournilhac F, Leibler L. J Polym Sci, Part A: Polym Chem. 2008;46(24):7925–7936. [Google Scholar]
- 59.Montarnal D, Tournilhac F, Hidalgo M, Couturier JL, Leibler L. J Am Chem Soc. 2009;131(23):7966–7967. doi: 10.1021/ja903080c. [DOI] [PubMed] [Google Scholar]
- 60.Montarnal D, Tournilhac F, Hidalgo M, Leibler L. J Polym Sci, Part A: Polym Chem. 2010;48(5):1133–1141. [Google Scholar]
- 61.Tournilhac F, Cordier P, Montarnal D, Soulié-Ziakovic C, Leibler L. Macromol Symp. 2010;291–292(1):84–88. [Google Scholar]
- 62.Cortese J, Soulié-Ziakovic C, Cloitre M, Tencé-Girault S, Leibler L. J Am Chem Soc. 2011;133(49):19672–19675. doi: 10.1021/ja209126a. [DOI] [PubMed] [Google Scholar]
- 63.Cortese J, Soulie-Ziakovic C, Tence-Girault S, Leibler L. J Am Chem Soc. 2012;134(8):3671–3674. doi: 10.1021/ja2119496. [DOI] [PubMed] [Google Scholar]
- 64.Maes F, Montarnal D, Cantournet S, Tournilhac F, Corte L, Leibler L. Soft Matter. 2012;8(5):1681–1687. [Google Scholar]
- 65.van Gemert GML, Peeters JW, Sontjens SHM, Janssen HM, Bosman AW. Macromol Chem Phys. 2012;213(2):234–242. [Google Scholar]
- 66.The displacements of dangling chains are results from dangling chains motion and network fluctuations. The latter can be represented by effective virtual chains.67 The self-healing polymer network can be considered to consist of dangling chains with one end fixed in space and the other being a sticker. The length of the effective dangling chain is the sum of the length of the actual dangling chain and the length of the virtual chain.
- 67.Rubinstein M, Colby RH. Polymer physics. Oxford University Press; Oxford; New York: 2003. p. xi.p. 440. [Google Scholar]
- 68.de Gennes PG. J Chem Phys. 1982;76(6):3316–3321. [Google Scholar]
- 69.Sun TL, Kurokawa T, Kuroda S, Ihsan AB, Akasaki T, Sato K, Haque MA, Nakajima T, Gong JP. Nat Mater. 2013 doi: 10.1038/nmat3713. advance on. [DOI] [PubMed] [Google Scholar]
- 70.Kremer K, Grest GS. J Chem Phys. 1990;92(8):5057–5086. [Google Scholar]
- 71.Hoy RS, Fredrickson GH. J Chem Phys. 2009;131(22) doi: 10.1063/1.3268777. [DOI] [PubMed] [Google Scholar]
- 72.Smith W, Forester TR. J Mol Graph. 1996;14(3):136–141. doi: 10.1016/s0263-7855(96)00043-4. [DOI] [PubMed] [Google Scholar]
- 73.Turq P, Lantelme F, Friedman HL. J Chem Phys. 1977;66(7):3039–3044. [Google Scholar]
- 74.Frenkel D, Smit B. Understanding molecular simulation : from algorithms to applications. 2. Academic; San Diego, Calif.; London: 2002. p. xxii.p. 638. [Google Scholar]


