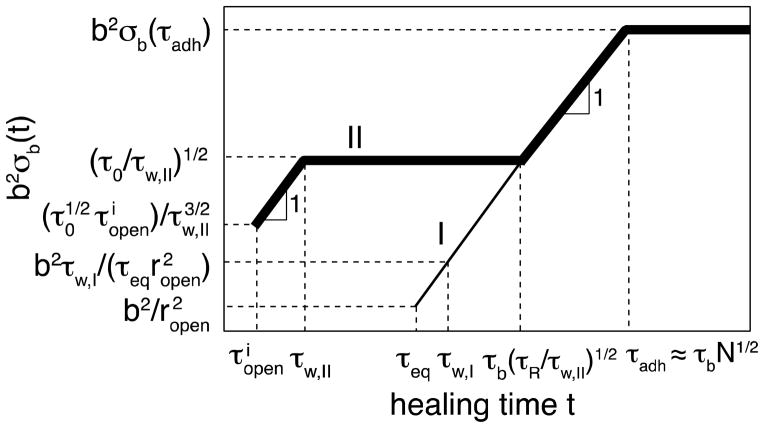
Figure 12.
The recovery of the surface density of bridges with intermediate binding energy kBT ln N < ε < 2kBT ln N for self-healing process corresponding to regime II in Figure 11 (τw < τeq < τR) is shown by thick line. The self-healing after long waiting time (τw > τeq) corresponding to regime I in Figure 11 is similar to self-adhesion and depicted by thin line. Both axes are logarithmic.

