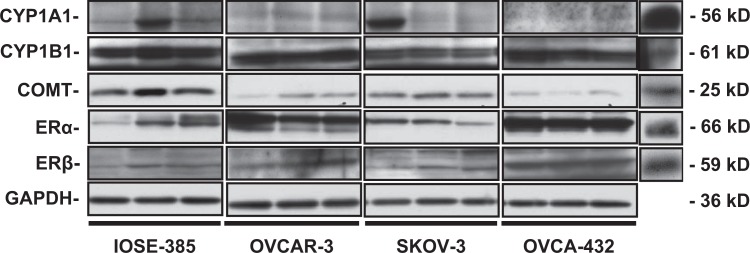
Figure 1.
Western bolt analysis of CYP1A1, CYP1B1, COMT, ERα, and ERβ in ovarian cells. Different lanes in each ovarian cell line represent different passages of cells. Glyceraldehyde 3-phosphate dehydrogenase (GAPDH) was utilized as a loading control. Positive controls (CTRL) were mouse liver (for CYP1A1), human placenta (for CYP1B1 and COMT), and mouse thyroid extracts (for ERα and ERβ). COMT indicates catechol-O-methyltransferase; CYP1A1, cytochrome P450, family 1, subfamily A; CYP1B1, cytochrome P450, family 1, subfamily B; ERα, estrogen receptor α.

