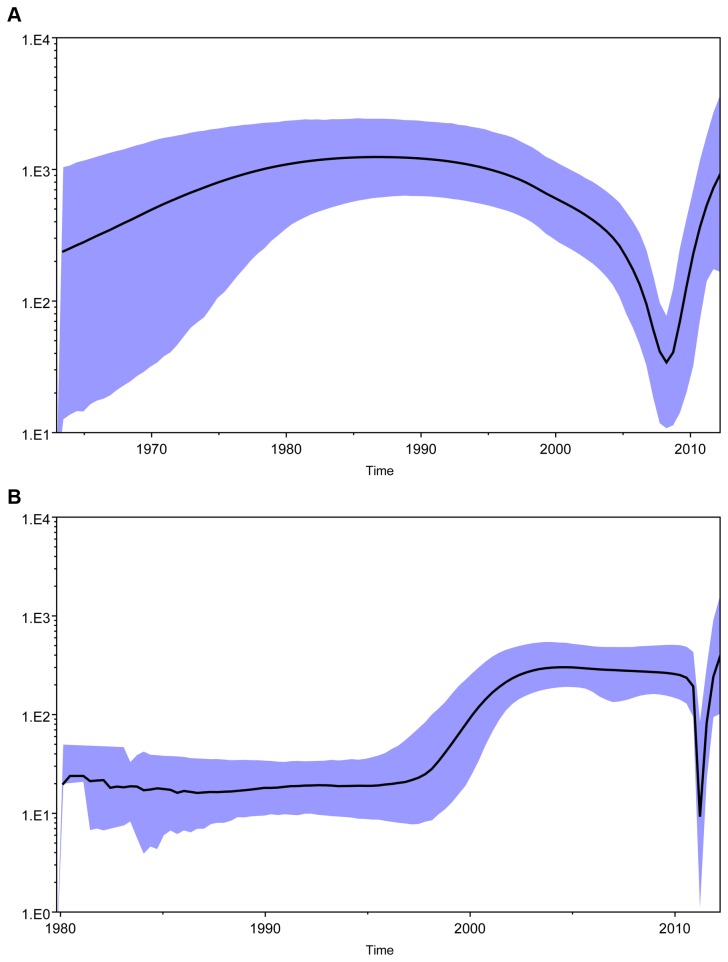
Figure 6. The reconstructed Bayesian skyline plot of the history of Heyuan HCV 2a and 6a clusters.
Bayesian skyline plot was reconstructed to estimate the effective infection numbers of Heyuan 2a cluster (A) and 6a cluster (B). X-axis is the year of the infection, Y-axis indicates the estimated HCV infection population size. Black line represents the estimated effective population size through time. The blue area represents the 95% upper and lower highest posterior density (HPD) confidence intervals for this estimate.

