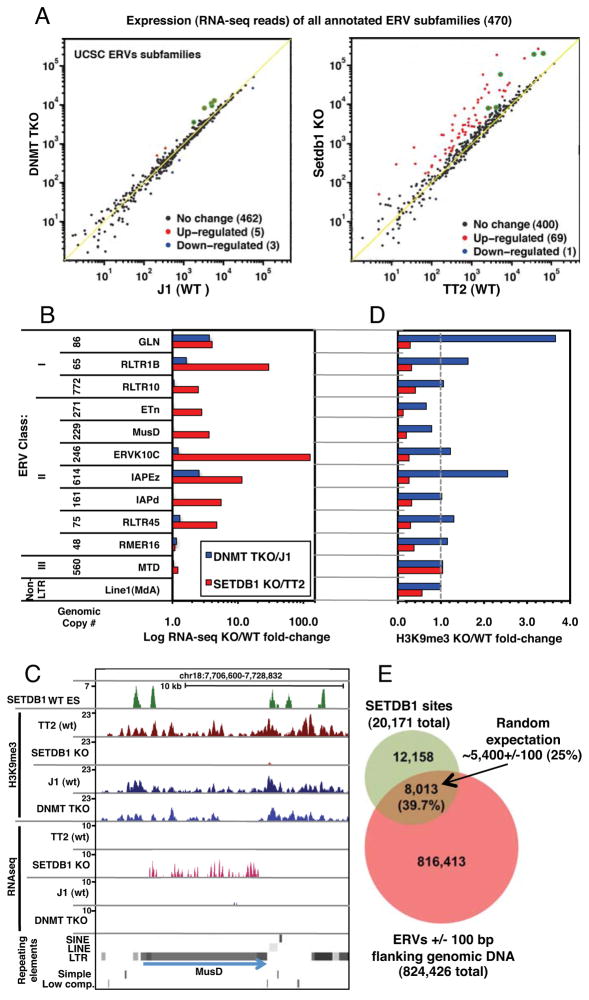
Figure 4. ERVs are de-repressed in SETDB1 KO but not DNMT TKO mESCs.
A. The sum of RNA-seq reads aligned to each annotated ERV subfamily was normalized to the total number of exonic reads and plotted for SETDB1 KO vs. TT2 and DNMT TKO vs. J1 lines. ERV subfamilies up or down-regulated in the KO lines are shown in red and blue, respectively. Subfamilies up-regulated in both lines are highlighted in green. B. For analysis of intact ERVs, the total normalized RNA-seq coverage for all annotated ERV internal regions flanked by their cognate LTRs was determined for representative class I, II and III ERV subfamilies, as well as LINE1MdA elements. The fold-change in expression for each pair of cells lines is shown. C. A screen shot of a representative ETnERV2/MusD element, including H3K9me3 NChIP-seq, RNA-seq and SETDB1 ChIP-seq (Yuan et al., 2009) tracks, is shown. D. The fold-change in H3K9me3 (including 1 kb of flanking genomic sequence) relative to the parent line for each subfamily presented in panel B is shown. E. The overlap between all annotated ERVs (+/−100 bp of flanking sequence) and mapped SETDB1 binding sites (threshold height >8) reveals that ~40% of all SETDB1 binding sites map within or near an annotated ERV (see Figures S3, S4 and Table S3). Random expectation of ~25% is based on 20 bootstraps (p-value <0.05).

