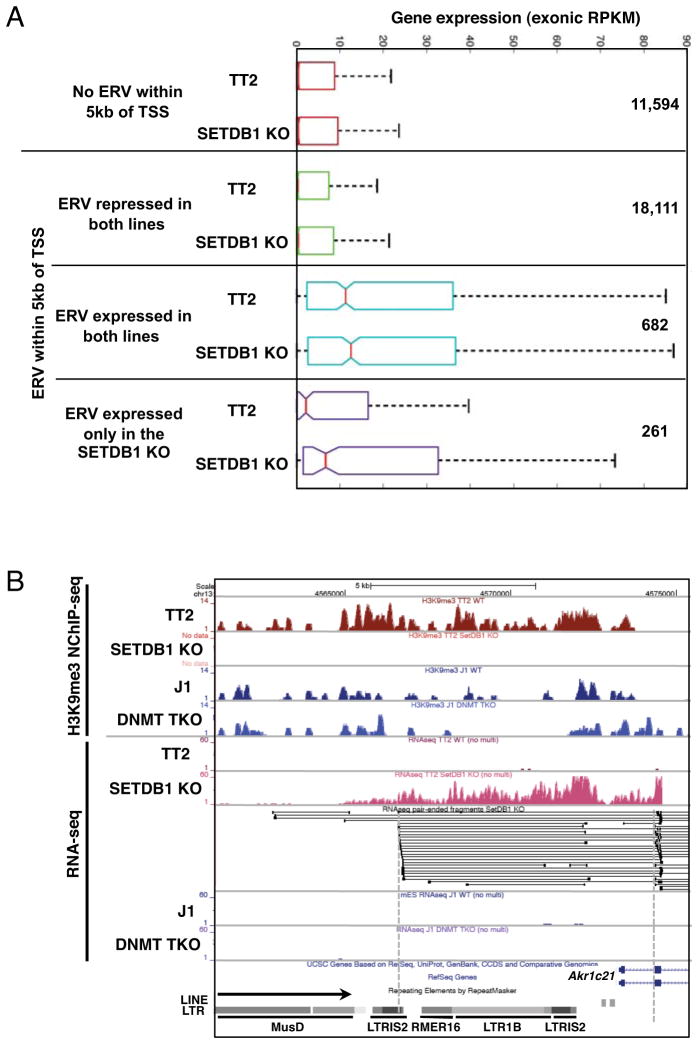
Figure 6. Increased genic expression in SETDB1 KO mESCs is associated with increased expression of promoter proximal ERVs.
A. Protein coding genes were grouped according to the presence of an annotated ERV within 5kb of the annotated TSS(s) and then classified solely on the basis of the presence or absence of RNA-seq reads over these promoter proximal ERVs in the TT2 and/or SETDB1 KO lines. The distribution of RNA-seq coverage (normalized exonic RPKM) for genes with no proximal ERV is shown, along with genes harboring promoter proximal ERVs that are: 1. repressed in both lines (RNA-seq coverage <1.0 aRPKM)(See Supplemental Experimental Procedures); 2. expressed in both lines (RNA-seq coverage ≥1.0 aRPKM and SETDB1 KO aRPKM/TT2 aRPKM between .75 and 1.3); or 3. expressed predominantly in the SETDB1 KO line (RNA-seq coverage ≥1.0 aRPKM and SETDB1 KO aRPKM/TT2 aRPKM ≥10). The number of genes in each category is also shown. B. UCSC genome-browser screen shot of the 5′ end of the Akr1c21 gene, showing H3K9me3 NChIP-seq and RNA-seq tracks, alignment of the split paired-end RNA-seq reads in the locus and ERVs 5′ of the gene (see Figure S6).

