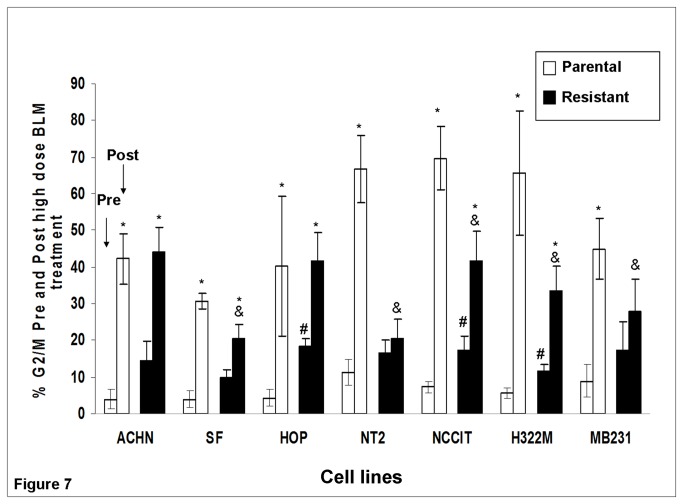
Figure 7. Summary of % G2/M phase distribution pre- and post- high dose BLM treatment in all 7 parental/resistant pairs.
High dose BLM treatment corresponds to ten times the corresponding maintenance concentration for each cell line. Mean ± SEM (n=3) values are reported. * P<0.05 for the comparison between cell lines prior to and after high dose BLM treatment. All parental lines exhibited significant increases in G2/M cell cycle distribution. # P<0.05 for comparison between parental and resistant cell lines at baseline (pre-treatment). Three of seven BLM-resistant cell lines (HOP0.05, NCCIT1.5, and H322M2.5) exhibited increased % G2/M distribution at baseline compared to their parental cell lines. & P<0.05 for comparison of % G2/M distribution between parental and resistant cell lines after BLM treatment. Less % G2/M distribution than parental lines was found in five out of seven BLM-resistant cell lines (SF0.4, NT20.1, NCCIT1.5, H322M2.5, and MB2313.0) after BLM treatment.

