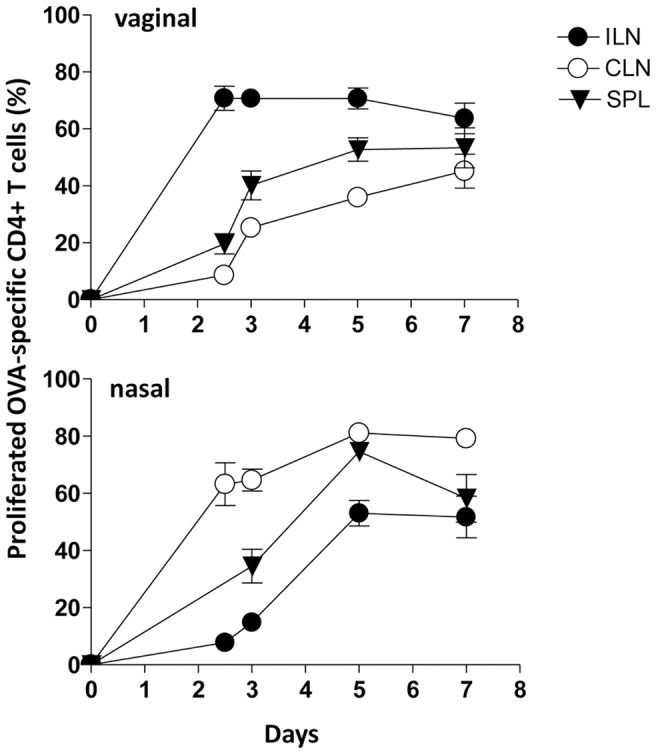
Figure 6. Time course analysis of the OVA-specific CD4+ T-cell clonal expansion following vaginal or nasal immunization.

The clonal expansion of adoptively transferred CD4+ T cells following vaginal or nasal immunization with OVA plus CpG ODN 1826 was analyzed on days 2.5, 3, 5, and 7 post immunization in draining and distal lymph nodes and spleen. Values reported in y axis indicate the percentage of proliferating antigen-specific T cells. OVA-specific T cells were identified as CD4+ CFSE-positive populations, with light scatter properties of lymphocytes. The percentages of proliferating cells are shown on the y axis. Bars represent the means ± standard errors of the means (SEM) of values from nine mice assessed in three separate experiments.
