Figure 4.

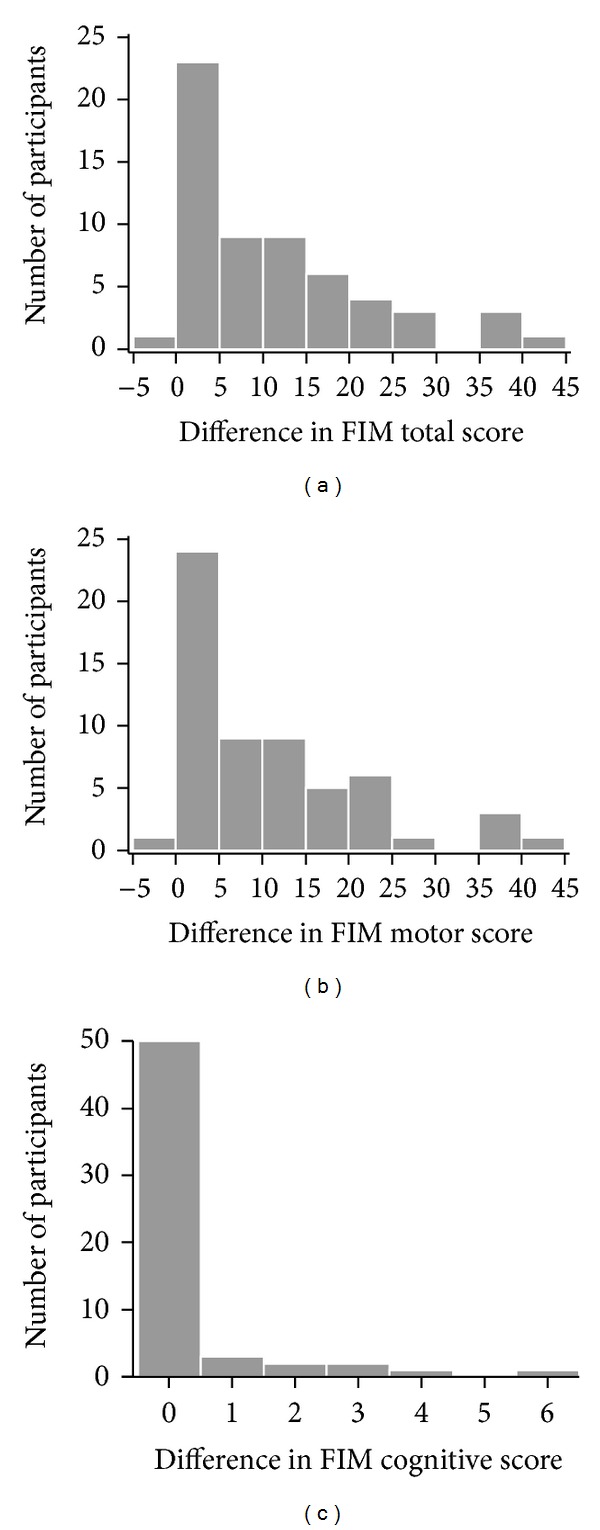
Distribution of differences in FIM scores between the first and the second assessment (histograms for total and motor score, bar chart for cognitive score).

Distribution of differences in FIM scores between the first and the second assessment (histograms for total and motor score, bar chart for cognitive score).