Figure 5.

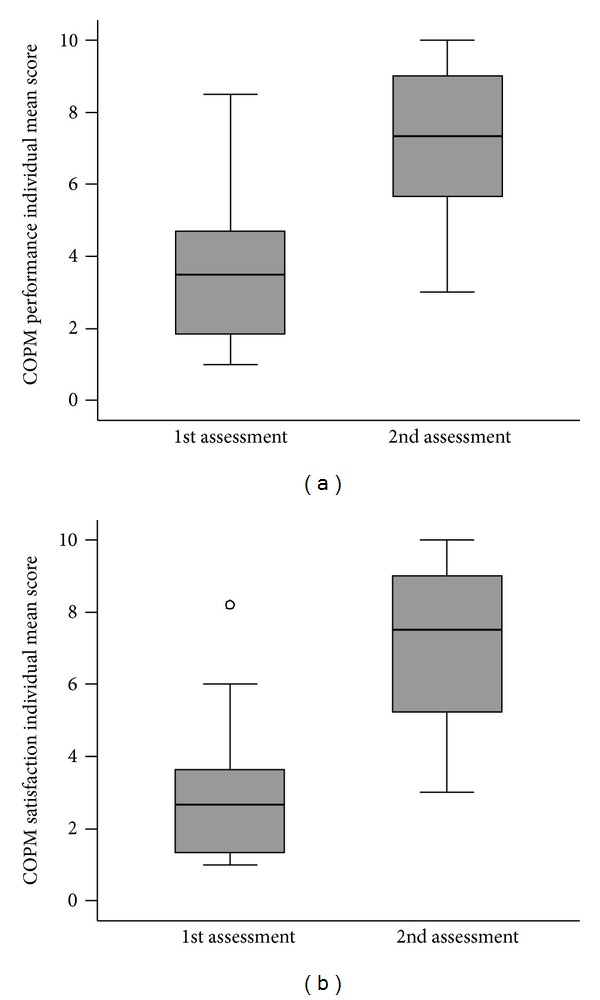
Box plots of COPM individual mean scores at the first and the second assessments (thick line—median; box—IQR: interquartile range, whiskers—values within 1.5 IQR from the 1st and 3rd quartile; circles—outliers).

Box plots of COPM individual mean scores at the first and the second assessments (thick line—median; box—IQR: interquartile range, whiskers—values within 1.5 IQR from the 1st and 3rd quartile; circles—outliers).