Figure 7.

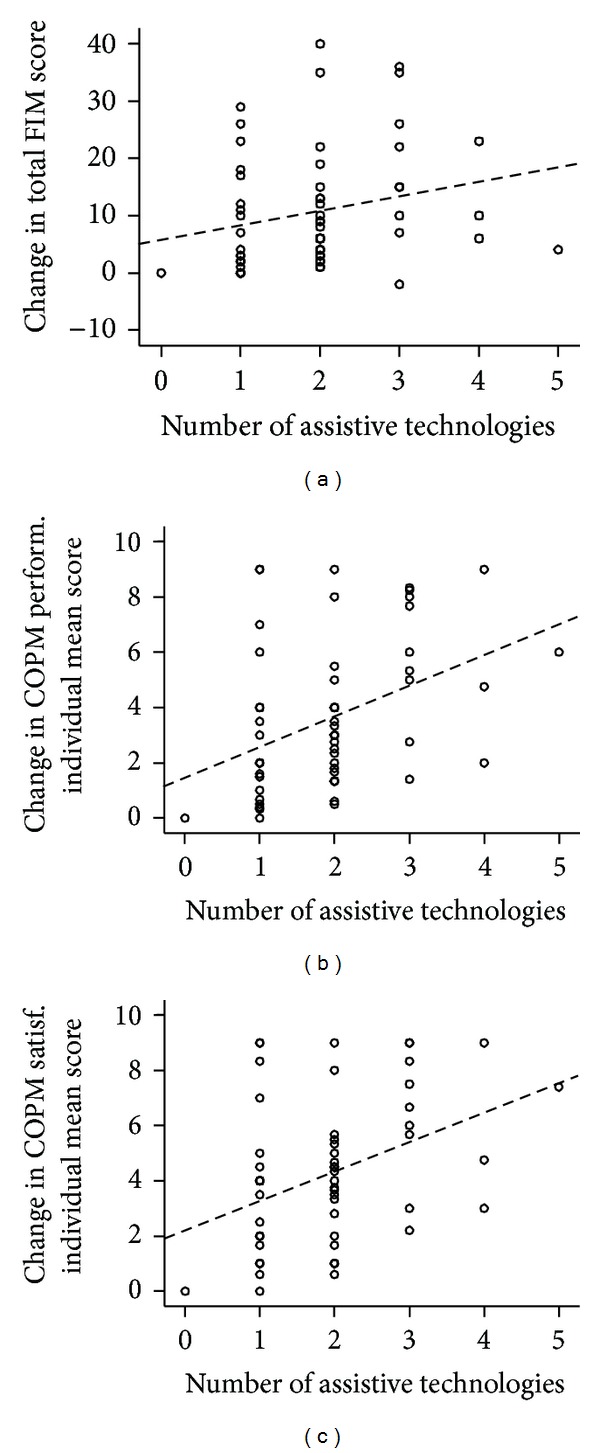
Scatter plots with linear regression lines (dashed; for illustrative purposes only) depicting association of the number of assistive technologies with progress in the outcome measures.

Scatter plots with linear regression lines (dashed; for illustrative purposes only) depicting association of the number of assistive technologies with progress in the outcome measures.