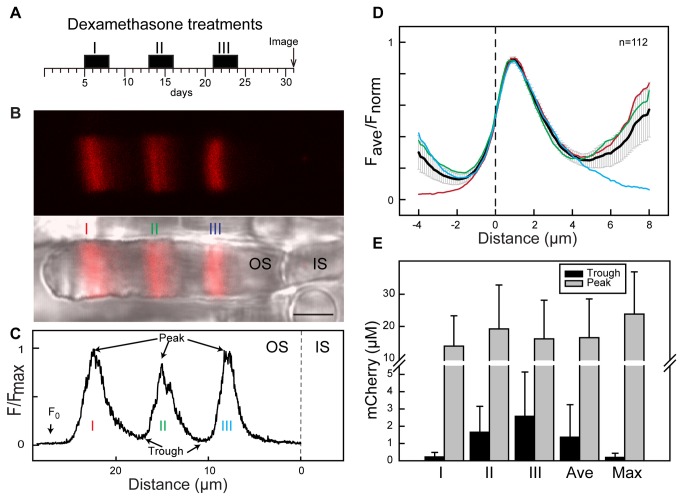
Figure 4. Repetitive induction responses in individual rods.
(A) Schematic diagram of the Dex treatment paradigm. (B) Fluorescence (top) and merged with DIC (bottom) images of a live rod that received three Dex treatments. Labels I, II and III indicate fluorescence responses corresponding to the different inductions. Scale bar is 5 μm. (C) Relative fluorescence intensity profile of the rod in (B). For reference, the position of IS/OS junction was set as 0 μm. The maximum intensity (Peak) and minimum intensity (trough) between two induction responses are indicated. F0 indicates the pre-induction background expression level. (D) Average normalized fluorescence intensity distribution of rods that received repetitive induction. Data were pooled from 112 inductions of 44 rods whose profiles were extracted from confocal images of 4 tadpoles ranging from St. 52-56. The fluorescence distribution for each rod was aligned at the position where fluorescence in the rising phase is 50% of maximum (designated as 0 μm, dotted line). The average relative fluorescence intensity for all responses is plotted (black line). The average lines of for induction I (red), II (green) and III (blue) are shown. Error bars represent 95% confidence. (E) Average peak and trough Rho-mCherry concentrations derived from the fluorescence intensity for the three different inductions are shown. The 'Ave' is the average concentration of all inductions. The 'Max' is the maximum response in each rod. Error bars represent standard deviation (n = 61, 66, 45, 172, 68 respectively).

