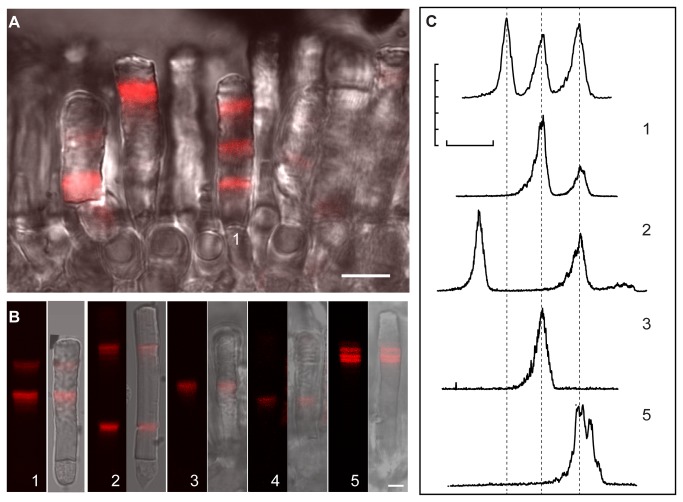
Figure 5. Distribution of Rho-mCherry in live rods after repetitive 3-day induction.
(A) Live rods with one to three responses in a retina chip are shown with the fluorescence merge with DIC. Scale bar is 10 μm. (B) Five individual rods with two (2,3) or one (4,5) responses are shown with fluorescence and merged with DIC . Scale bar is 5 μm. (C) Relative mCherry fluorescence intensity profiles of several different live rods, which received same treatment but exhibited different responses. Top scan is from the cell in A with three responses and the others from cells indicated in B. Scale bar on the x-axis represents 10 μm.

