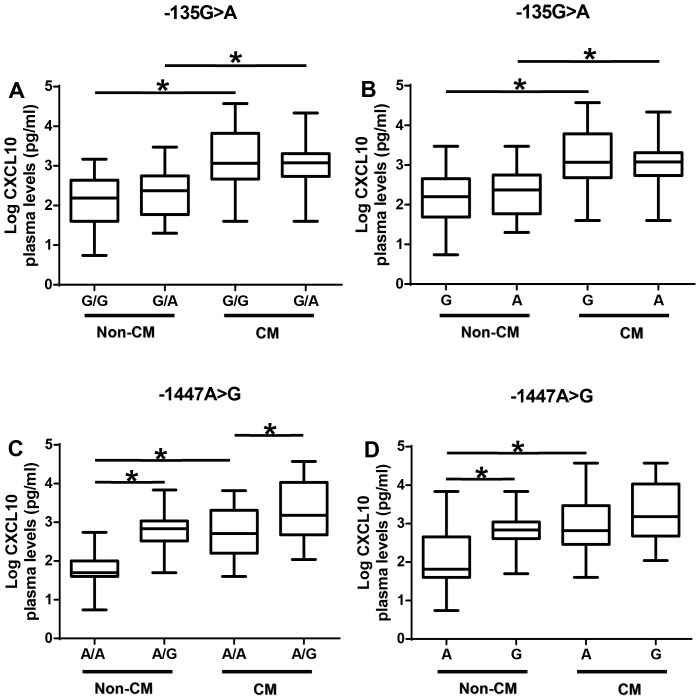
Figure 3. Association between −135G>A and −1447A>G polymorphism with plasma CXCL10 levels stratified by disease group.
(A) Effect of −135G>A polymorphism genotype on plasma CXCL10 protein levels stratified by disease group. (B) Effect of −135G>A polymorphism allele on plasma CXCL10 protein levels stratified by disease group. (C) Effect of −1447A>G polymorphism genotype on plasma CXCL10 protein levels stratified by disease group. (D) Effect of −1447A>G polymorphism allele on plasma CXCL10 protein levels stratified by disease group. Box plot represent log-transformed medians with 25th and 75th percentiles, bars for 10th and 90th percentiles. The distribution of plasma CXCL10 expression levels among non-CM and CM patients segregated according to the genotype was analyzed with the Kruskal-Wallis test, followed by a Dunn's multiple-comparison, with p<0.05 considered significant. Asterisk (*) indicates a significant difference (p<0.05).

