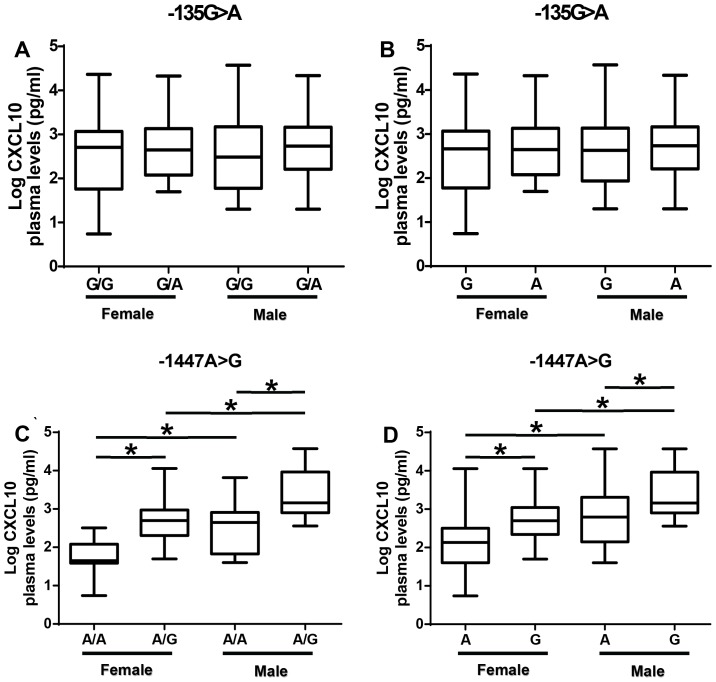
Figure 4. Association between −135G>A and −1447A>G polymorphism with plasma CXCL10 levels stratified by gender.
(A) Effect of −135G>A polymorphism genotype on plasma CXCL10 protein levels stratified by gender. (B) Effect of −135G>A polymorphism allele on plasma CXCL10 protein levels stratified by gender. (C) Effect of −1447A>G polymorphism genotype on plasma CXCL10 protein levels stratified by gender. (D) Effect of −1447A>G polymorphism allele on plasma CXCL10 protein levels stratified by gender. Box plot represent log-transformed medians with 25th and 75th percentiles, bars for 10th and 90th percentiles. The distribution of plasma CXCL10 expression levels among females and males segregated according to the genotype was analyzed with the Kruskal-Wallis test, followed by a Dunn's multiple-comparison, with p<0.05 considered significant. Asterisk (*) indicates a significant difference (p<0.05).

