Figure 5.

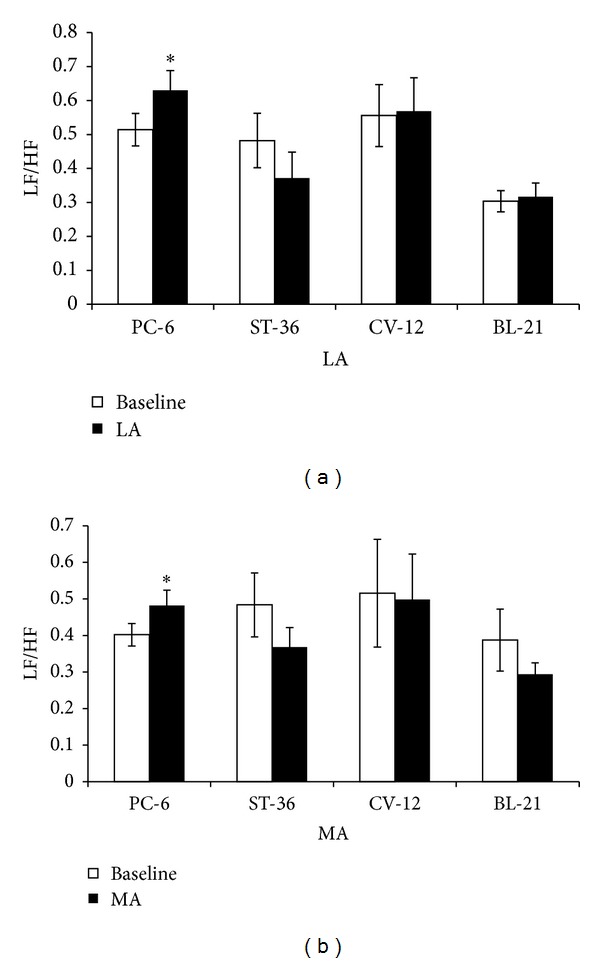
Change rate of LF/HF induced by LA or MA at four acupoints, respectively. (a) shows LF/HF by LA and (b) shows LF/HF by MA at PC-6, ST-36, CV-12, or BL-21, respectively (n = 10). *P < 0.05, compared with baseline.

Change rate of LF/HF induced by LA or MA at four acupoints, respectively. (a) shows LF/HF by LA and (b) shows LF/HF by MA at PC-6, ST-36, CV-12, or BL-21, respectively (n = 10). *P < 0.05, compared with baseline.