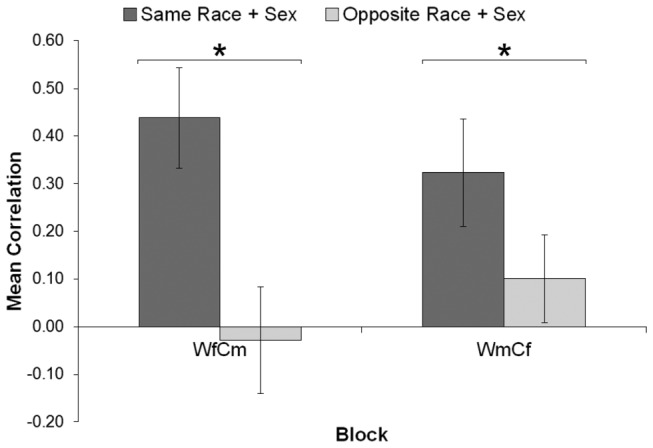
Figure 3. Mean correlation in Experiment 3 for each block and trial type.

Error bars indicate 95% confidence interval and can be used to compare conditions to zero (i.e., error bars overlapping the zero line are not significantly different from zero). WfCm = White females and Chinese males, WmCf = White males and Chinese females. Same/opposite race + sex = face on previous trial is the same or opposite in both race and sex. * p < .001.
