Figure 6.

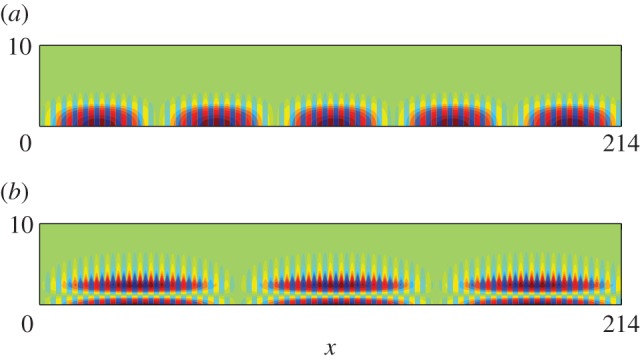
Plots of ℜ(u) from HFH for a comb with a=3 (cf. figure 5), generated by a line source at (a) Ω=0.4509 and (b) Ω=1.3138, respectively. (Online version in colour)

Plots of ℜ(u) from HFH for a comb with a=3 (cf. figure 5), generated by a line source at (a) Ω=0.4509 and (b) Ω=1.3138, respectively. (Online version in colour)