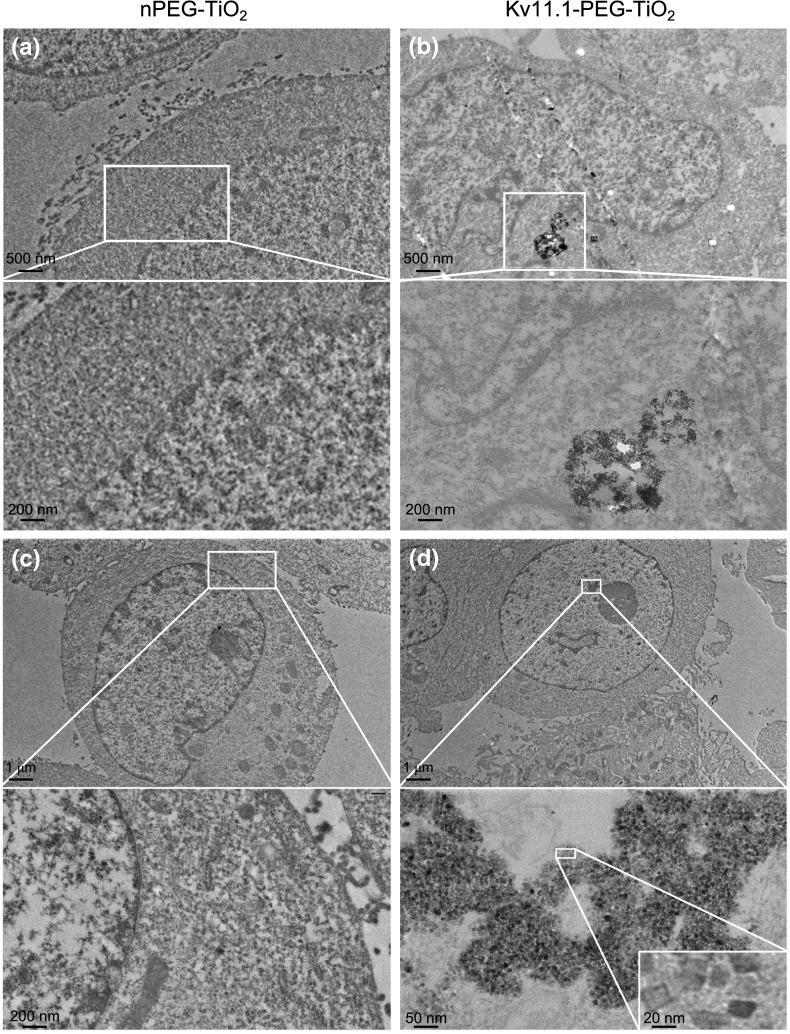
Fig. 5.
TEM pictures of PDAC cells trated with PEG–TiO2 NPs or Kv 11.1-Mab-PEG–TiO2 NPs: a, c Panc-1 treated with PEG–TiO2 NPs (0.1 %). b MIAPaCa-2 treated with Kv 11.1-Mab-PEG–TiO2 NPs (0.1 %); d Panc-1 treated with Kv 11.1-Mab-PEG–TiO2 NPs (0.1 %); TEM was performed after exposure for 48 h to either PEG–TiO2 or Kv 11.1-Mab-PEG–TiO2 NPs. Scale bars are reported on the bottom left of each panel

