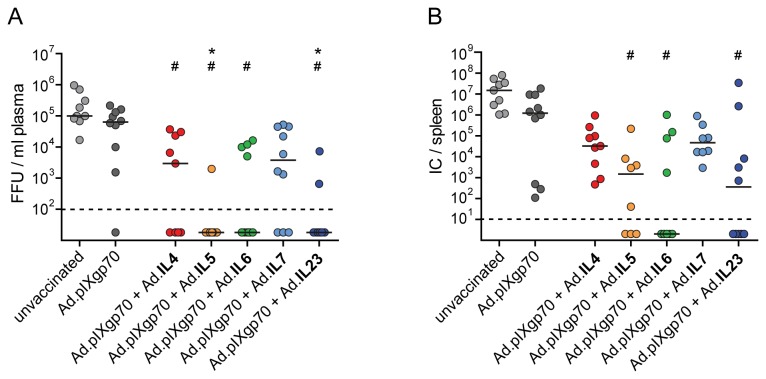
Figure 2. Viral loads of vaccinated mice after FV challenge infection.
CB6F1 mice were prime- and boost-immunized with Ad.pIXgp70 in combination with interleukin-encoding adenoviral vectors. Mice were challenged with FV 3 weeks after boost immunization. Plasma viremia (A) in FV infected mice was analyzed on day 10 p.i. and is shown as focus forming units (FFU) / ml plasma, median values are indicated by lines. On day 21 p.i. viral loads in spleen (B) were analyzed and are shown as infectious centers (IC) / spleen, the horizontal lines mark median values. Statistically significant differences (P < 0.05; Kruskal-Wallis one-way analysis of variance on ranks with Dunns multiple comparison procedure) compared to unvaccinated mice (#) or mice immunized with Ad.pIXgp70 alone (*) are indicated. For statistical analysis, mice with viral loads below the detection limits were assigned the values 20 for viral load in blood, or 2 for viral load in spleen. Values were subjected to statistical analysis without logarithmic transformation. Each dot represents an individual animal. The dashed lines indicate the detection limits of the assays. Data are results of two independent experiments with similar outcome.

