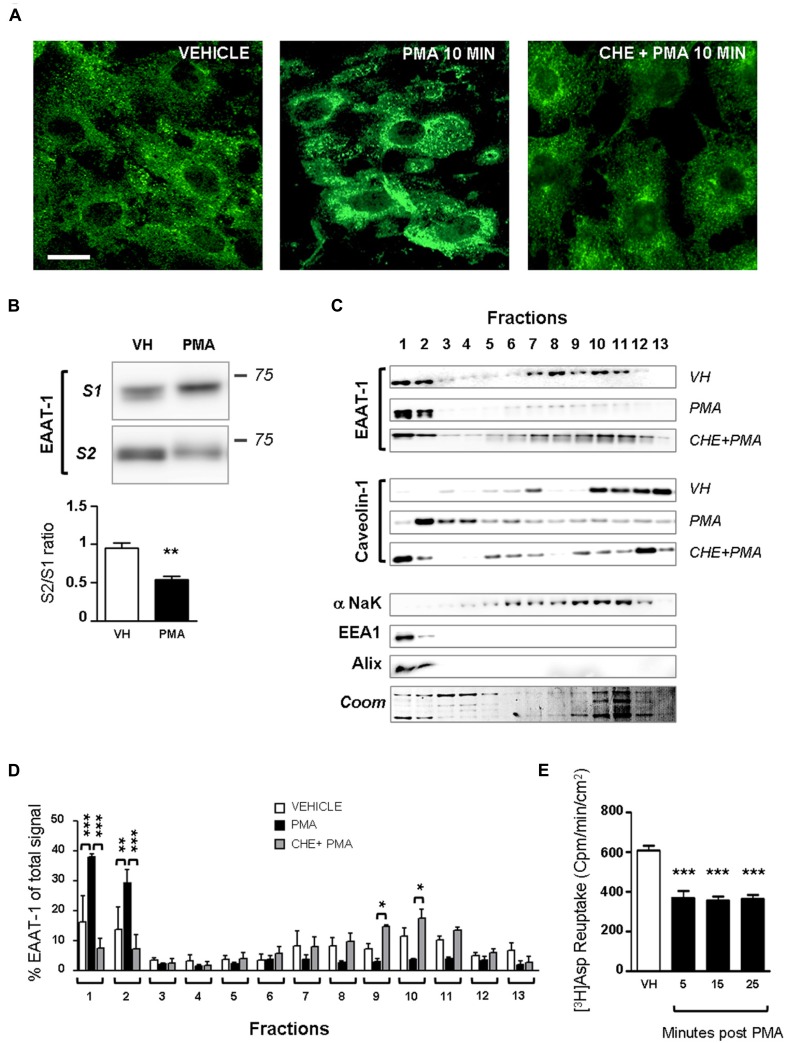
FIGURE 2.
PKC activation modifies EAAT-1 sub-cellular distribution in primary astrocytes. (A) Fluorescence confocal microscopy showing the EAAT-1 immunoreactivity in vehicle-treated (left picture), PMA-treated (middle panel) and PKC inhibitor chelerythrine (CHE)/PMA-treated astrocytes (right picture). Scale bar: 10 μm. (B) Surface biotinylation of astrocytes showing the increased signal for internalized EAAT-1 (S1, non-biotinylated) and reduced surface EAAT-1 (S2, biotinylated) after PMA. One lane represents a homogenate from 75 cm2 confluent astrocytes. Quantifications were made from 5 blots corresponding to 5 independent flasks. **p < 0.01, Student’s t-test. (C) Subcellular fractionation by ultracentrifugation on sucrose gradient followed by western-blot showing that PMA treatment produces a relative enrichment of EAAT-1 in low density fractions 1–2 also rich in early (EEA1) and late (Alix) endosomes, as opposed to the reduction of EAAT-1 signal in plasma membrane (NaK ATPase) rich fractions 7–11. Pretreatment with CHE fully abolishes the EAAT-1 enrichment in fractions 1–2 both constitutively or upon PMA. (D) Bar histogram showing the quantification of EAAT-1 subcellular fractionation as a percentage of total signal. *p < 0.05; **p < 0.01; ***p < 0.001, two ways ANOVA, followed by Bonferroni post hoc test (n = 3 independent blots from 3 independent cultures). (E) [3H] Aspartate reuptake showing the inhibitory effect of PMA on the transport capacity of astrocytes (black bars) as compared to vehicle-treated cells (VH, white bar). ***p < 0.001 one way ANOVA followed by Dunnet’s post hoc test vs. vehicle column (n = 6 wells per condition).

