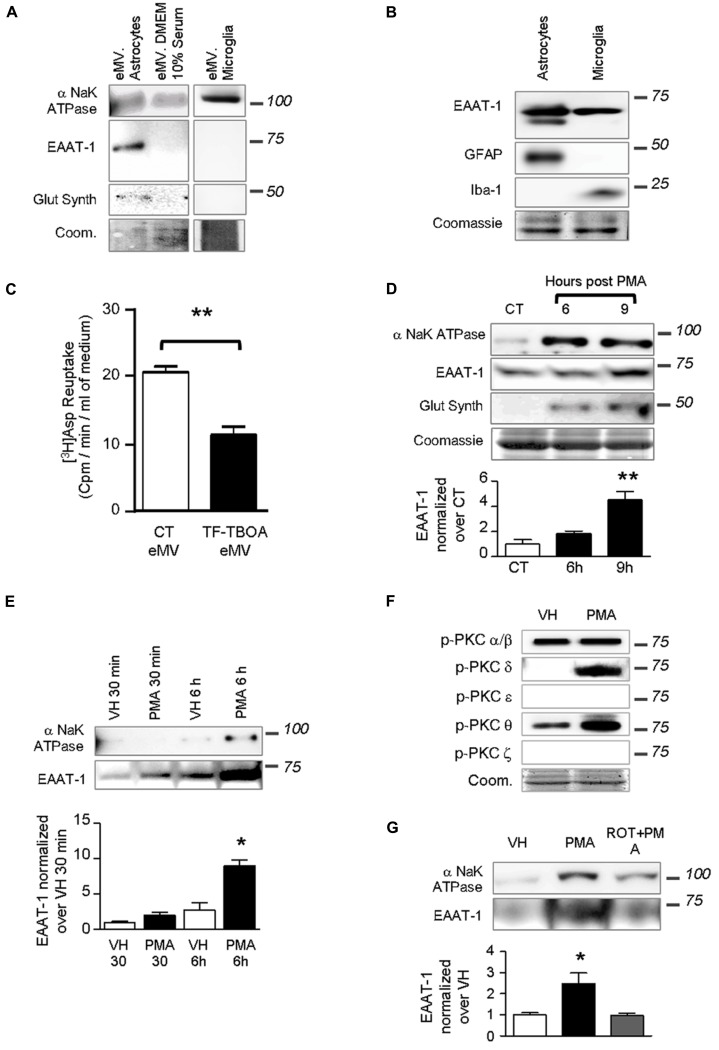
FIGURE 3.
Extracellular microvesicles from astrocytes contain functional EAAT-1. (A) Representative western blots showing NaK ATPase, EAAT-1 and glutamine synthetase in astrocyte-derived eMV, whereas only NaK ATPase is detected in eMV from microglia or serum. Lanes correspond to medium from 75 cm2 of confluent cells. Coomassie staining (coom) shows total protein content. (B) Western blots of astrocyte (GFAP positive) and microglia (Iba-1 positive) extracts showing that both cell types express EAAT-1 in culture (10 μg of proteins extracts loaded). (C) Bar graph showing [3H] aspartate reuptake from astrocyte-conditioned medium treated (black bar) or not (white bar) with the specific EAAT blocker TF-TBOA. Given as mean ± SEM. **p < 0.001, t-test with Welch correction, n = 3 samples from 3 independent dishes. (D) Time course study of eMV composition in response to PMA without medium replacement. An enrichment of NaK ATPase and glutamine synthetase is found at 6 and 9 h post-treatment together with an increase of EAAT-1 signal after 9 h, but without modifications of Coomassie staining. Bar graph shows quantification of EAAT-1. **p < 0.01, one way ANOVA followed by Dunnett’s post hoc test vs. control column (n = 4 samples from independent cultures for each condition). (E) Time course study (30 min and 6 h) of microvesicular NaK ATPase and EAAT-1 in response to PMA after a full medium change. A significant augmentation of EAAT-1 is observed 6 h post-PMA in comparison to eMV from vehicle treated cells.*p < 0.05, one way ANOVA followed by Dunnett’s post hoc test vs. control column (n = 4 samples from independent cultures). (F) Western-blots showing the PKC isoforms activated in primary astrocytes after PMA treatment. PMA treatment increases phospho-PKC-δ and -θ. Coomassie staining (coom) shows the total protein content. (G) Western blot showing that rottlerin counteracts the increase of EAAT-1 in eMV after PMA. The bar histogram shows the quantification of band intensities. *p < 0.05, one way ANOVA followed by Dunnett’s post hoc test vs. control column (n = 3 independent cultures for each condition).

