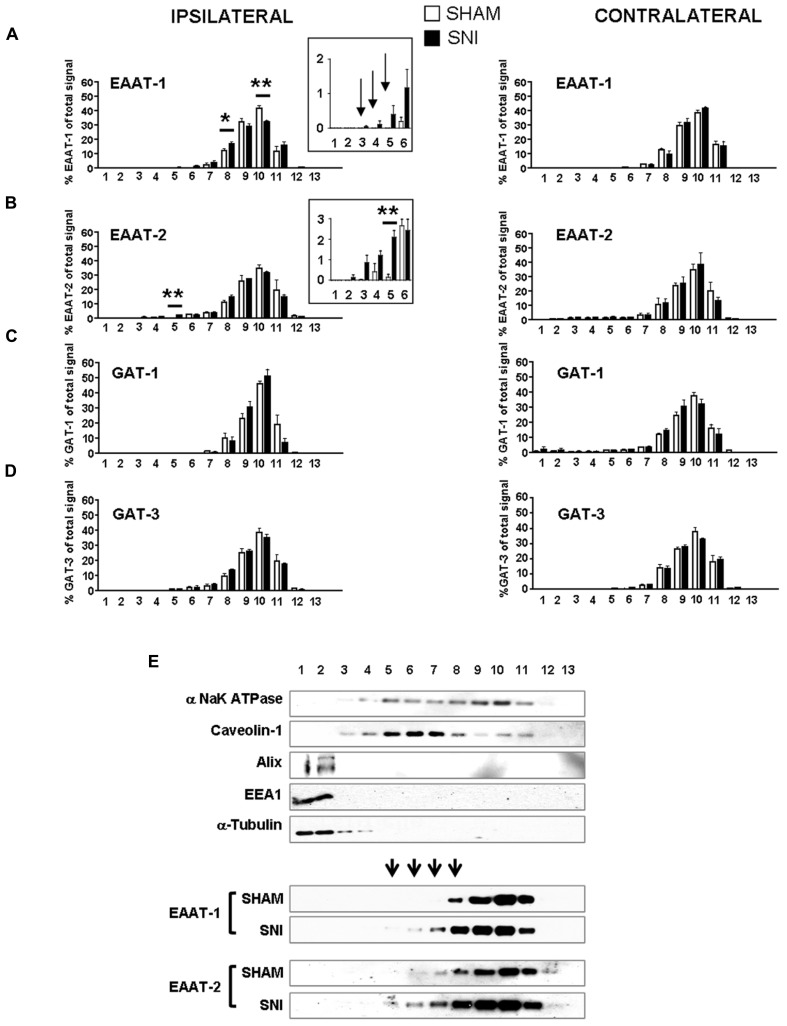
FIGURE 7.
(A–D) subcellular fractionation presented as bar histograms, showing the distribution patterns of glutamate and GABA transporters as a percentage over total signal in all fractions. A leftward shift is observed for EAAT-1 (A) and EAAT-2 (B). *p < 0.05; **p < 0.01, sham vs. SNI, t-test with Bonferroni correction for multiple comparisons (n = 5–6 rats for each condition). Arrows in (A) indicate signal detected in SNI samples with no counterparts in sham fractions. (E) Representative immunoblots of subcellular fractionation illustrating the shift of EAAT-1 and EAAT-2 content in SNI spinal cord, in the caveolin-1 enriched fractions. Arrowheads indicate fractions that are sites or EAAT-1 increase in SNI animals.

