
Figure 4.
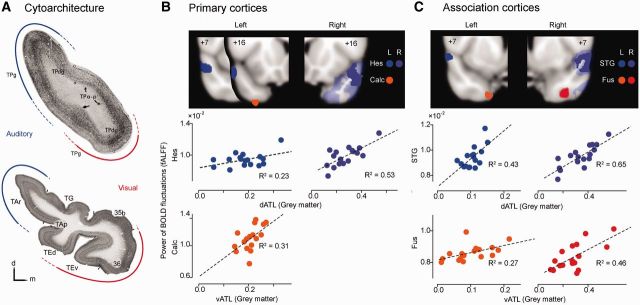
ATL subregion grey matter atrophy predicts fractional ALFF values within visual versus auditory processing regions. (A) Top: Coronal section through the ATL of the rhesus monkey, showing cytoarchitectural subdivisions [reprinted with permission from Fig. 1 in Morán et al., 1987)]. Tract tracing results suggested that auditory inputs predominate in the dorsolateral part of the temporopolar cortex (blue) whereas visual inputs become more prominent in the ventral ATL (red). TPa-p = temporopolar cortex, agranular periallocortical; TPdg = temporopolar cortex, dysgranular; TPg = temporopolar cortex, granular. Bottom: Human ATL coronal section illustrating parallel cytoarchitectural subdivisions, reprinted (left–right flipped for comparison) with permission from Fig. 9A in Ding et al. (2009). The authors commented (p. 621) that Area TAr is thought to be involved in higher order auditory processing (blue), whereas anterior areas 35, 36, and TE are thought to be involved in high order visual processing (red). TAr = the area rostral to area TA; TAp = the polysensory area in the dorsal bank of the STS; TEd, TEr = dorsal and ventral parts of area TE; TG = the area caps the tip of temporal pole; 35B, 36 = Area 35b and 36 based on Brodmann (Brodmann, 1909). Temporal areas TA and TE are based on Von Ecomono and Koskinas (Von Economo, 1929). Voxel-based regression analyses included (B) primary cortices (calcarine sulcus and Heschl’s gyrus) and (C) sensory association cortices (fusiform and superior temporal gyri). Consistent with connectivity-based predictions, distinct ATL clusters were identified whose grey matter volumes significantly correlated with fractional ALFF values in posterior visual (orange and red) and auditory (blue and purple) processing regions, thresholded at P < 0.01. In the right hemisphere model (A and B, right), more expansive clusters were identified at this threshold for auditory regressors (transparent purple) and were further thresholded at P < 0.005 (solid purple) to illustrate the region of peak significance. Results for left and right hemispheres are labelled in different colour tones.