Figure 5.
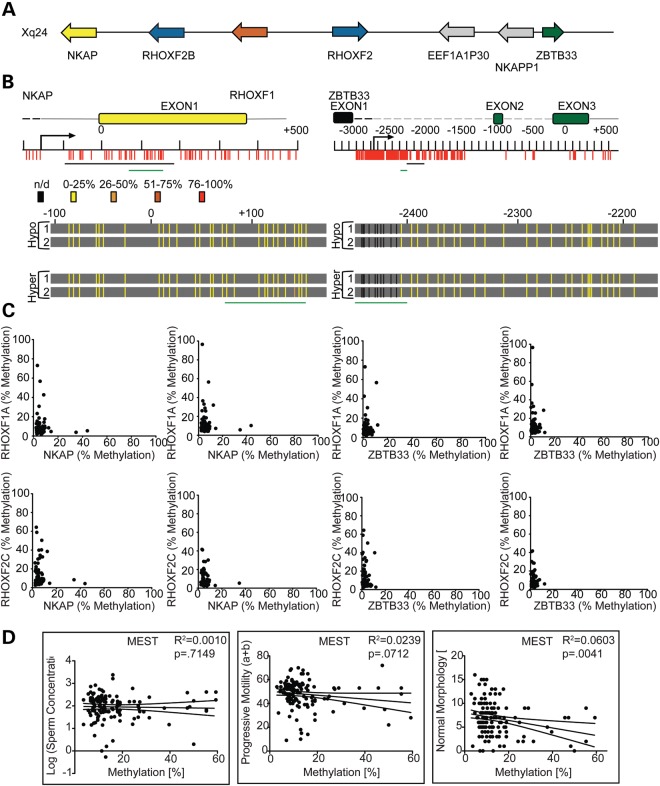
Hypermethylation in sperm from infertility patients is restricted to the RHOX cluster. (A) An expanded region of the X chromosome is shown depicting the location and direction of genes neighboring the RHOX cluster. Gray arrows indicate pseudogenes. (B) NKAP and ZBTB33 gene CpG residues and gene features are drawn to scale. The regions analyzed by bisulfite sequencing are shown as a black line and the regions analyzed by pyrosequencing are shown as a green line under the gene and/or under the bisulfite sequencing results, which are depicted in heat map style as in Figure 2. Black vertical lines indicate residues that were not analyzed by bisulfite sequencing. (C) DNA from the sperm of the entire infertile patient population was analyzed for percent methylation (number of Cs compared with number of Ts incorporated into the pyrosequencing run) in the NKAP and ZBTB33 genes at the regions indicated by green bars in (B). The results were plotted on the x-axis and compared with the percent methylation of each RHOX region, which is plotted on the y-axis. (D) MEST methylation was plotted against the severity of patient sperm defects as in Figure 1B. See Table 2 for N values.

