Figure 2.
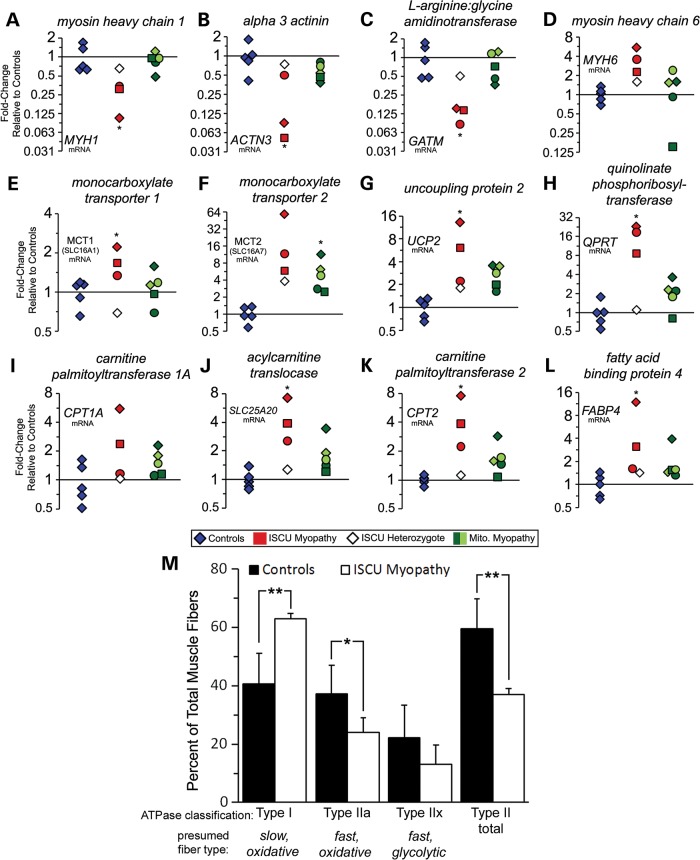
Structural and metabolic remodeling during chronic Fe-S cluster deficiency results in a predominance of type I muscle fibers and elevated fatty acid oxidation genes. qRT-PCR demonstrated decreased expression of type II muscle fiber contractile protein MYH1 (A: average 0.25-fold), the structural protein ACTN3 (B: average 0.21-fold) and the creatine biosynthetic enzyme GATM (C: average 0.13-fold). (D) Cardiac myosin MYH6 expression was increased by an average of 3.8-fold in ISCU myopathy patient biopsies. (E and F) Expression of lactate/pyruvate transporters MCT1 and MCT2 was increased in ISCU myopathy patient biopsies. (G) Mitochondrial uncoupling protein 2 (UCP2) was increased by an average of 7.2-fold in ISCU myopathy patients and 2.7-fold in the mitochondrial myopathy patients. (H) Quinolinate phosphoribosyltransferase (QPRT) was elevated by an average of 16.8-fold in ISCU myopathy patient biopsies. (I) Liver-specific carnitine palmitoyltransferase I (CPT1A) mRNA was increased in two of the three ISCU myopathy patients evaluated. (J) The acyl-carnitine translocase SLC25A20 was significantly increased by an average of 4.5-fold in ISCU myopathy patients. (K) Carnitine palmitoyltransferase II (CPT2) was significantly increased by an average of 4.6-fold. (L) Cytosolic fatty acid-binding protein 4 (FABP4) was increased by an average of 5.5-fold in ISCU myopathy patients. The non-transformed 2−ΔΔCt values were analyzed by one-way ANOVA with Holm–Sidak post hoc test to determine statistical significance. (M) Muscle fiber composition in control and ISCU myopathy patient muscle biopsy sections was quantified histochemically by myosin ATPase staining. Type I fibers showed a predominance in patients (n = 3) compared with controls (n = 13), whereas the number of type IIa fibers was significantly lower, and the number of type IIx (IIb) fibers trended lower. Two-tailed, unpaired t-tests were used here to determine statistical significance. *P < 0.05; **P < 0.01.

