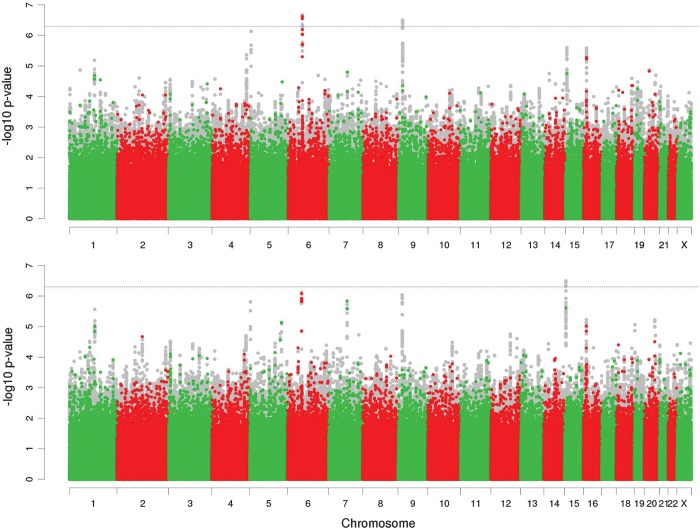
Figure 2.
Plot of –log10 transformed P-values of SNP associations with 12-month remission of seizures from the meta-analysis of the UK and AUS cohorts. Top, unadjusted for significant clinical prognostic factors; bottom, adjusted for significant clinical prognostic factors. Coloured dots correspond to genotyped SNPs and grey dots imputed SNPs. The dashed horizontal line marks a P-value significance threshold of 5.0 × 10⁻⁷.

