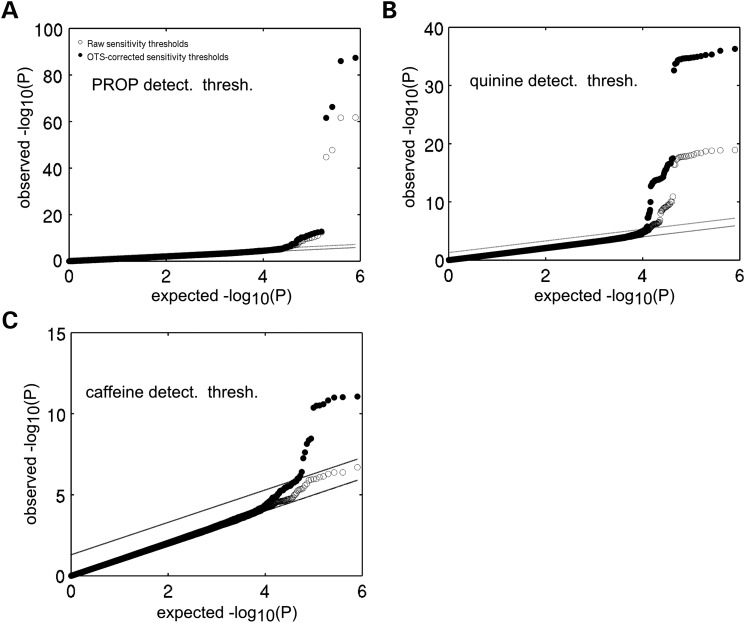
Figure 1.
Across-phenotype correction boosts association signal for taste detection thresholds. QQ-plots of the GWAS for detection thresholds of PROP (A), quinine (B) and caffeine (C) showing the boost in association strength afforded by cross-phenotype correction. Open circles indicate P-values obtained from GWASs conducted for taste detection thresholds that were corrected only for demographics (gender, age, BMI) and the first 10 principal components of a genetic ancestry analysis. Solid circles indicate P-values obtained when detection thresholds were additionally corrected for overall taste sensitivity.

