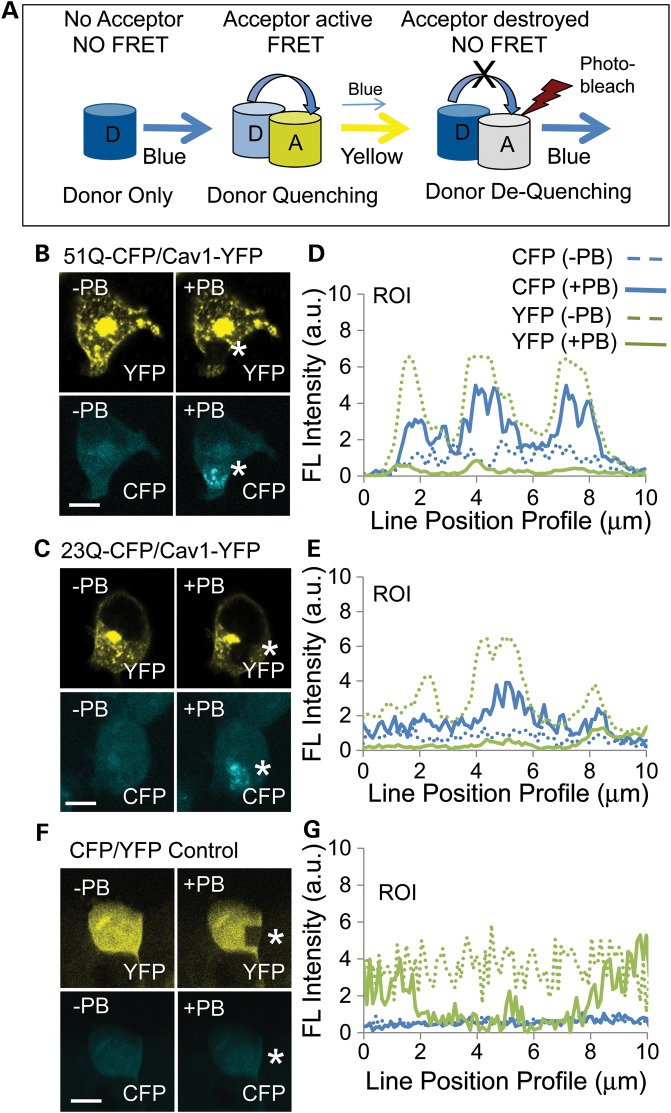
Figure 1.
Htt and mhtt directly interact with Cav1 in cells. (A) Schematic of a FRET dequenching experiment. The CFP donor alone emits blue in the absence of an acceptor. FRET occurs when emission of the donor excites the acceptor. Under these conditions, the CFP signal decreases (quenching) and the YFP acceptor signal increases. If the YFP acceptor is photobleached, then there is no FRET and the intensity of the CFP donor emission increases (dequenching). Blue cylinder is the CFP donor and the yellow cylinder is the YFP acceptor; the white cylinder indicates photodestruction of the acceptor and loss of its signal intensity after repeated laser scanning at 514 nm (red lightening bolt). (B and C) Images of the mhtt 51Q–CFP (B), or htt 23Q–CFP (C), or Cav1–YFP expression before (−PB) and after (+PB) photobleaching. HEK293 T cells were transfected with plasmids to coexpress fusion proteins Cav1–YFP (acceptor) and the 51Q–CFP (B) or the 23Q–YFP donors (C). FRET is measured by the increase in the 51Q–CFP (B) or 26Q–CFP (C) donor signal (blue) after photobleaching (+PB) of Cav1–YFP. The white star indicates the site of the photobleaching, which appears as a black hole in the yellow signal or an elevated blue signal. (E and F) Quantification of the results from (B and C). Donor dequenching was determined by line pixel analysis of images (pixels in the ROI highlighted by white stars in YFP panels). The solid blue line is CFP after photobleaching (+PB); the dashed blue line is 51Q–CFP (E) or 26Q–CTF (F) before photobleaching (−PB), as indicated; the solid green line is Cav1–YFP after photobleaching (+PB); the dashed green line is Cav1–YFP before photobleaching (−PB). (D) As a negative control, plasmids encoding only CFP and YFP were cotransfected into HEK293 T cells. The signal of CFP did not increase upon photobleaching of YFP, indicating no specific interaction between the two fluorophores. (G) Quantification of the results from (F). Parameters are the same as in (E) and (F). Scale bar is 10 µm in all image panels.

