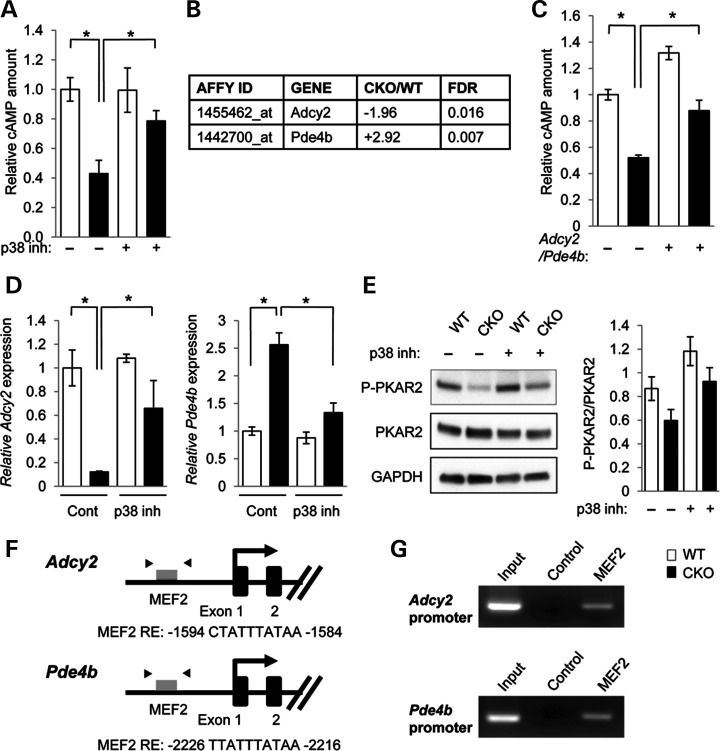
Figure 2.
Identification of target molecules regulating lipid metabolism in Tgfbr2 mutant cells. (A) Quantitation of cAMP levels in the MEPM cells of Tgfbr2fl/fl (WT, white bars) and Tgfbr2fl/fl;Wnt1-Cre (CKO, black bars) mice. *P < 0.05. (B) Summary of microarray analysis results from MEPM cells of WT and CKO mice. Forty-seven gene transcripts were down-regulated in Tgfbr2fl/fl;Wnt1-Cre MEPM cells compared with Tgfbr2fl/fl MEPM cells. Forty-four gene transcripts were up-regulated in CKO MEPM cells compared with WT MEPM cells. n = 4 per genotype. Altered gene expression of 5′-cyclic monophosphate (cAMP) regulators is listed. (C) Measurement of cAMP in the MEPM cells of WT and CKO mice after Adcy2 overexpression and Pde4b siRNA knock-down (+) or control treatment (−). *P < 0.05. (D) Quantitative reverse transcription polymerase chain reaction (RT–PCR) analyses of Adcy2 and Pde4b in WT and CKO MEPM cells after treatment with p38 MAPK inhibitor SB203580 (p38 inh.) or no drug control (Cont.). *P < 0.05. (E) Immunoblotting analysis of indicated molecules related to PKA signaling in MEPM cells from WT and CKO mice treated with (+) or without (−) p38 inhibitor. Bar graphs (right) show the ratios of phosphorylated PKAR2 to PKAR2 following quantitative densitometry analysis of immunoblotting data. *P < 0.05. (F) Schematic diagram of mouse Adcy2 and Pde4b promoter regions showing putative MEF2 response elements (REs) identified by genomatix software within the Adcy2 and Pde4b genes. Arrowheads indicate the position of primers used in ChIP analysis. (G) ChIP analysis to detect MEF2 binding of the Adcy2 and Pde4b promoter in MEPM cells. PCR was performed using primers indicated in Materials and Methods.

