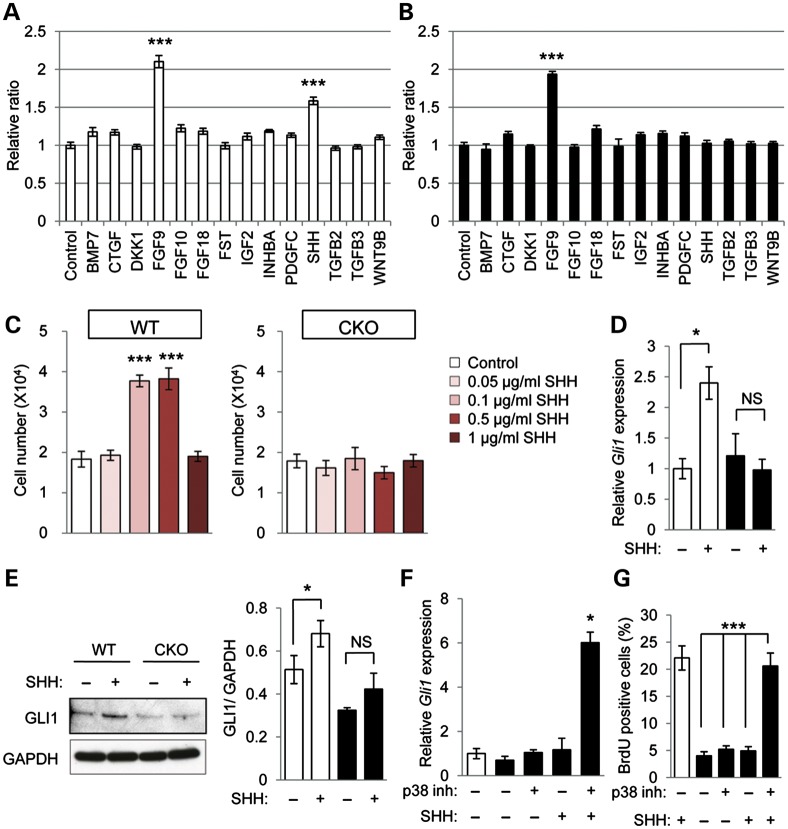
Figure 3.
SHH response is impaired in Tgfbr2 mutant cells. (A and B) Cell proliferation assays in Tgfbr2fl/fl littermate (white bars, A) and Tgfbr2fl/fl;Wnt1-Cre (black bars, B) mice after 24 h of culturing with indicated molecules. ***P < 0.001. (C) Cell proliferation assays of MEPM cells from WT and CKO mice after 24 h of culturing with various concentrations of SHH protein (0, 0.1, 0.5 and 1.0 μg/ml). ***P < 0.001. (D) Quantitative RT–PCR analyses of Gli1 with (+) or without (−) SHH treatment in WT and CKO MEPM cells. *P < 0.05. NS, not significant. (E) Immunoblotting analysis of GLI1 expression with (+) or without (−) SHH in MEPM cells of WT and CKO mice. Bar graph (right) shows the ratio of GLI1 to GAPDH following quantitative densitometry analysis of immunoblotting data. *P < 0.05. NS, not significant. (F) Quantitative RT–PCR analyses of Gli1 with (+) or without (−) p38 MAPK inhibitor and/or SHH treatment in WT and CKO MEPM cells. *P < 0.05. (G) BrdU incorporation assay after treatment of MEPM cells from WT and CKO mice with (+) or without (−) p38 MAPK inhibitor and/or SHH. Bar graph shows the percentage of BrdU-positive cells. ***P < 0.001.

