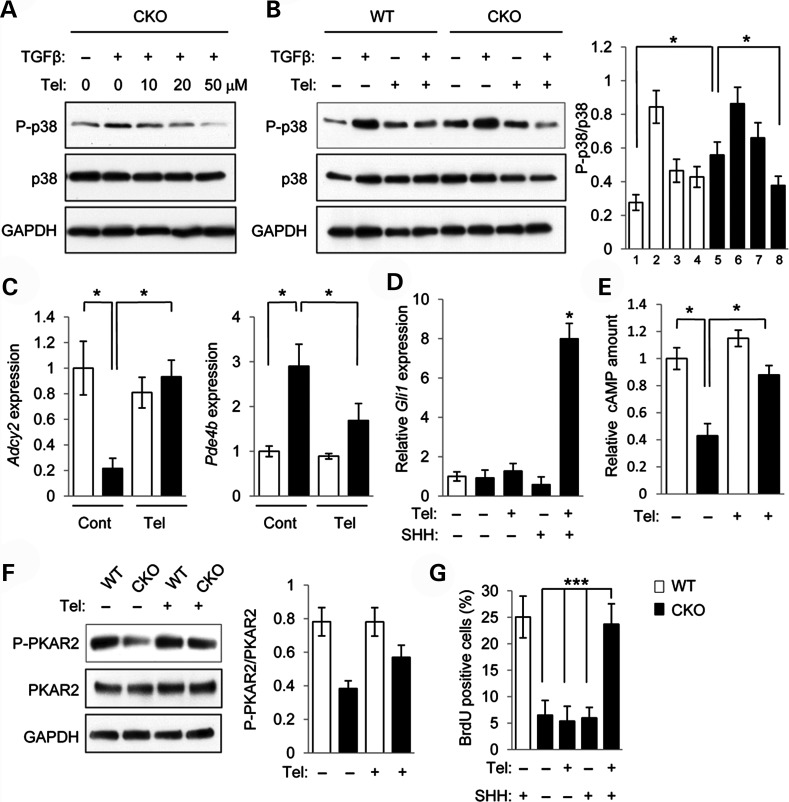
Figure 4.
Telmisartan restores p38 MAPK activation and cell proliferation activity in Tgfbr2 mutant cells. (A) Immunoblotting analysis of indicated molecules after treatment with telmisartan at indicated concentrations and addition (+) or no addition (−) of TGFβ in MEPM cells from Tgfbr2fl/fl;Wnt1-Cre (CKO) mice. (B) Immunoblotting analysis of indicated molecules in MEPM cells from Tgfbr2fl/fl (WT) and Tgfbr2fl/fl;Wnt1-Cre (CKO) mice after treatment with (+) or without (−) TGFβ and/or telmisartan. Bar graph (right) shows the ratios of phosphorylated p38 to p38 following quantitative densitometry analysis of immunoblotting data. White bars, WT; black bars, CKO. (C) Quantitative RT–PCR analyses of Adcy2 and Pde4b in WT and CKO MEPM cells with (Tel.) or without (Cont.) telmisartan treatment. *P < 0.05. (D) Quantitative RT–PCR analyses of Gli1 in WT and CKO MEPM cells with (+) or without (−) telmisartan treatment. *P < 0.05. (E) Quantitation of cAMP levels in the MEPM cells of WT and CKO mice after telmisartan treatment (+) or no treatment (−). *P < 0.05. (F) Immunoblotting analysis of indicated molecules after treatment with (+) or without (−) telmisartan in MEPM cells from WT and CKO mice. Bar graph (right) shows the ratios of phosphorylated PKAR2 to PKAR2 following quantitative densitometry analysis of immunoblotting data. (G) BrdU incorporation assay after treatment with (+) or without (−) telmisartan and/or SHH in MEPM cells from WT and CKO mice. Bar graph shows the percentage of BrdU-positive cells. ***P < 0.001.

