Figure 5.
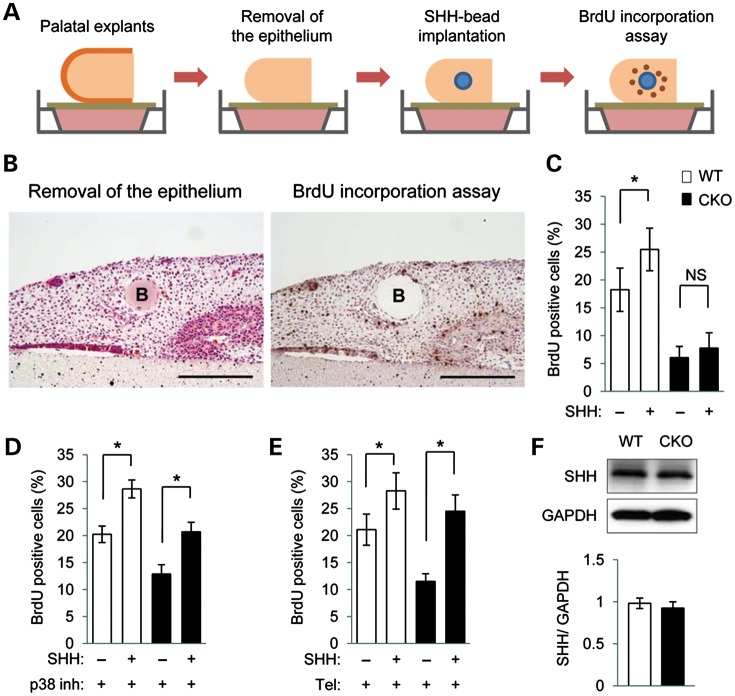
SHH response is normalized in Tgfbr2 mutant palates after treatment with p38 MAPK inhibitor or telmisartan. (A) Schematic diagram of sample preparation and assay. Palatal explants with the palatal epithelium removed were cultured with BSA or SHH-containing beads for 24 h. BrdU staining was performed to measure cell proliferation activity. (B) H&E (left) and BrdU (right) staining of Tgfbr2fl/fl;Wnt1-Cre palatal explants 24 h after epithelium removal and implantation of SHH-containing beads. B, bead. Bars, 200 μm. (C) Quantification of BrdU-positive cells in bead implantation samples. White bars, WT; black bars, CKO. NS, not significant. Five samples per group were used. *P < 0.05. (D) Quantitation of the percentage of BrdU-labeled nuclei in the palates of WT and CKO mice treated with p38 MAPK inhibitor and SHH (+) or BSA control (−) beads for 24 h. *P < 0.05. (E) Quantitation of the percentage of BrdU-labeled nuclei in the palates of WT and CKO mice treated with telmisartan and SHH (+) or BSA control (−) beads for 24 h. *P < 0.05. (F) Immunoblotting analysis of SHH in the palates of WT and CKO mice at E14.5. Bar graph (below) shows the ratio of SHH to GAPDH following quantitative densitometry analysis of immunoblotting data.

