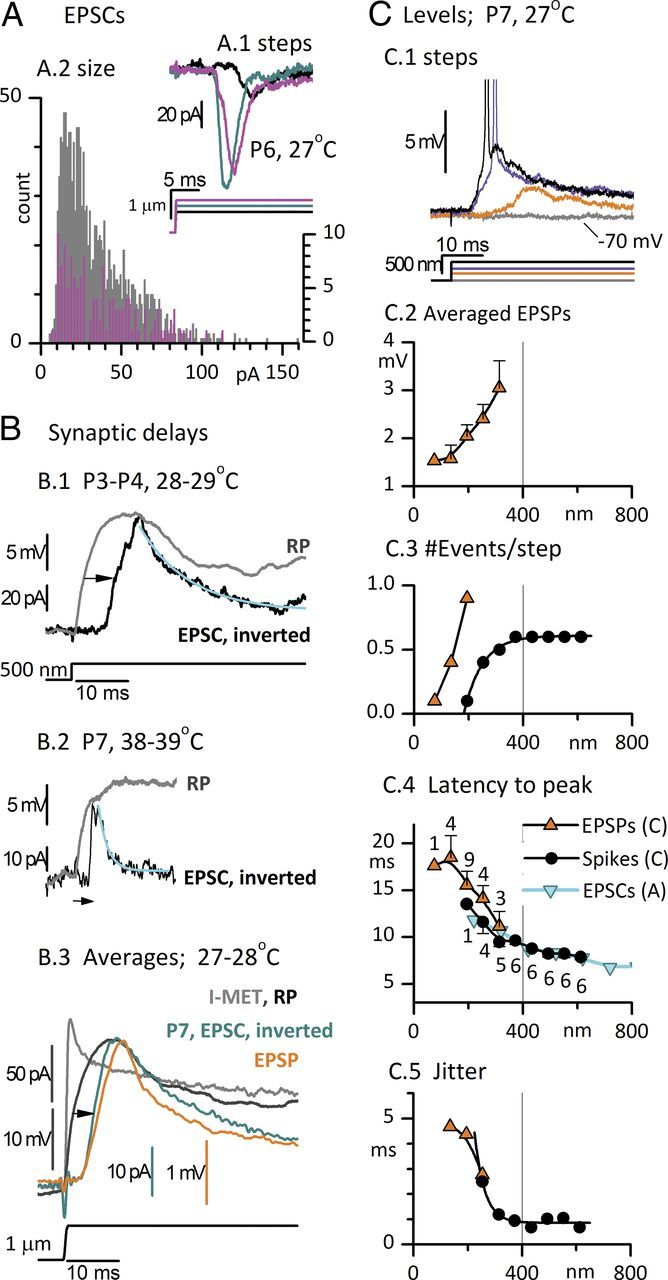
Figure 4.

Timing and level dependence of postsynaptic currents, potentials, and spikes recorded from striolar calyces in response to step displacements of type I hair bundles. A, EPSCs. A.1, Responses of a P6 calyx to three positive bundle displacements. Latencies from step onset to onset of first EPSC: 10 ms for the black step; 6.5 ms for the cyan and magenta steps. Latencies to first EPSC are plotted against displacement in F (cyan inverted triangles). A.2, Distributions of EPSC peak sizes from five striolar complex calyces (gray bars, 25–29°C, P4–P7); the distribution for the calyx of A.1 is superimposed (magenta, expanded count scale on right axis). B, Step-evoked RPs from striolar type I hair cells are compared with EPSCs (inverted for comparison) from striolar calyces; records were obtained independently but are matched for stimulus, postnatal age, epithelial zone, and temperature. B.1, Type I: P3, 28°C; calyx: P4, triple, 29°C. The delay of the EPSC relative to the RP (arrow) is 6 ms. EPSC decay time constant (cyan curve) is 9.6 ms. The height of the EPSC (95 pA) suggests summation of five miniature events (vesicles). B.2, P7 type I hair cell at 38°C (with low-voltage-activated conductance, gK,L; see Fig. 10); P7 double calyx at 39°C. Delay from RP to EPSC (arrow), 2.6 ms. EPSC decay time constant (cyan curve), 1.8 ms. B.3, Averaged EPSCs (inverted, 21 traces) and averaged EPSPs (17 traces) from a P7 double calyx at 27°C in response to +1 μm step deflections of a single hair bundle; compare with Imet and RP of a single type I hair cell (same hair cell as in B.1). Mean peak EPSC and EPSP values are −31 pA and 2.2 mV, corresponding to ∼1.5–2 vesicles (based on size distribution data in A). Synaptic delay from averaged RP to averaged EPSC (arrow), 4.6 ms. Monoexponential fits to the decays of the averaged EPSC and EPSP had time constants of 15.1 and 7.7 ms, respectively (fits not shown). C, Level dependence of EPSPs and spikes evoked in a double calyx by step deflections of one of its input hair bundles (P7, 27°C). C.1, As level (bundle displacement) increased (bottom traces), EPSP latency decreased and EPSP size increased until spike threshold (∼−63 mV in this calyx) was crossed (purple trace). A further increase in bundle displacement reduced spike latency (black trace). C.2–C.5, In mixed EPSP and spike responses (as in C.1), EPSPs (orange triangles) and spikes (black circles) were analyzed separately. EPSP traces that did not give rise to spikes were averaged together (n's for EPSPs for C.4 and C.5 are given in C.4 next to the data points). EPSPs at levels above spike threshold are not shown; instead, spikes are counted. C.2, Average EPSP peak size increased from 1.5 mV (∼1 quantum) at displacements < 200 nm to 3 mV (∼2 quanta) at 300 nm. All EPSPs occurred near the beginning of the step, but because of jitter in their timing (C.5), aligning the averaged traces by the onset of the displacement step reduced the peak relative to an average made by aligning quantal events (data not shown). C.3, Number of events per step. This calyx lacked spontaneous activity; EPSPs were first detected at +75 nm and increased in number per step until they started triggering spikes at +200 nm. C.4, C.5, Latency (C.4, step onset to response peak) and jitter (C.5) declined for both EPSPs and spikes as bundle displacement increased up to ∼300 nm. At higher levels, spike latency (measured at spike peak) and jitter plateaued at 7.9 and 0.7 ms, respectively. C.4, Cyan triangles, First EPSC latencies from the calyx of A.1 show a long minimum latency similar to that for spikes in the calyx featured in C.
