. Author manuscript; available in PMC: 2013 Dec 10.
Published in final edited form as: Ecol Lett. 2013 Jan 24;16(4):10.1111/ele.12075. doi: 10.1111/ele.12075

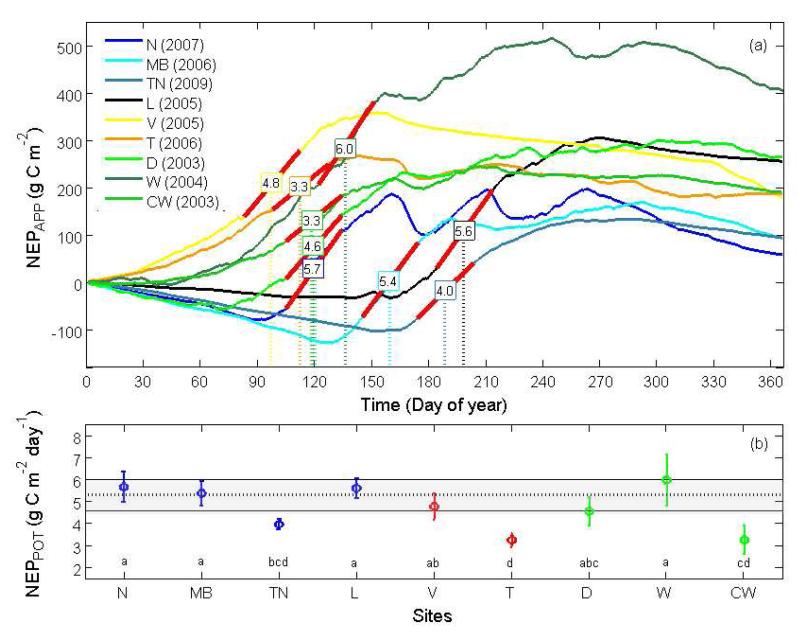
Figure 4. (a) Cumulative apparent net ecosystem production (NEPAPP) for years when potential [=maximum 30-day mean NEPAPP] NEP (NEPPOT) occurred at the grasslands sites Neustift (N), Monte Bondone (MB), Torgnon (TN), Lethbridge (L), Vaira (V), Tojal (T), Dripsey (D), Wexford (W) and Carlow (CW). Red slopes visualize NEPPOT sustained over 30 days; numbers in rectangles show associated slope values; dotted vertical lines visualize the timing of NEPPOT (b) NEPPOT for grasslands in the cold-temperate (blue), Mediterranean (red), and maritime (green) regions; grey band indicates the convergence zone for NEPPOT (dotted horizontal line shows mean NEPPOT); same letters indicate no significant difference; error bars indicate ±2 standard error of site-specific NEPPOT (n = 30).

Figure 4