. Author manuscript; available in PMC: 2013 Dec 10.
Published in final edited form as: Ecol Lett. 2013 Jan 24;16(4):10.1111/ele.12075. doi: 10.1111/ele.12075

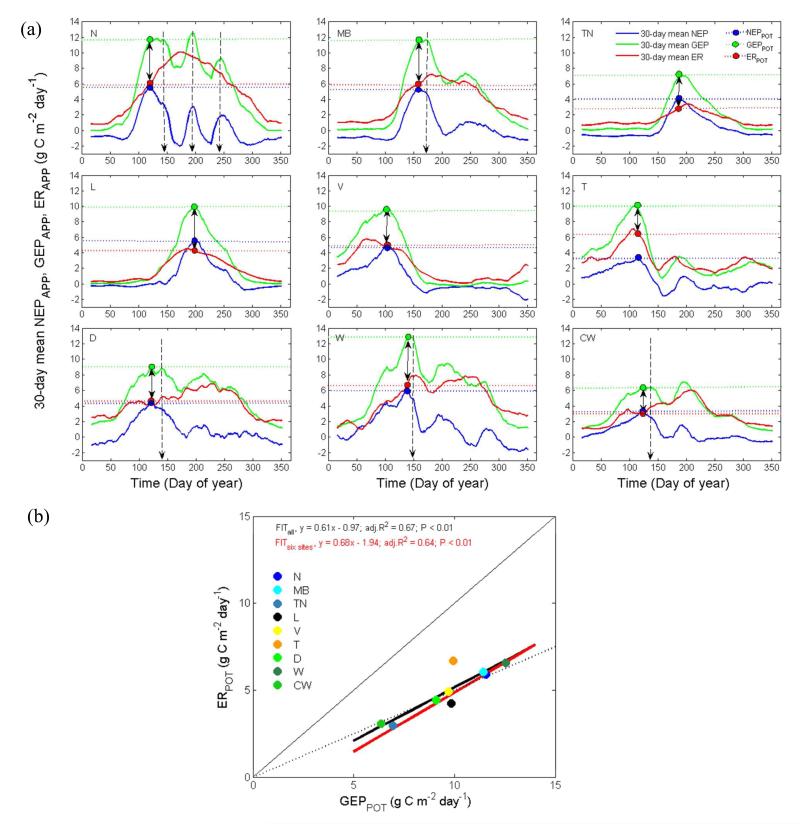
Figure 5. (a) 30-day mean apparent net ecosystem production (NEPAPP), gross ecosystem production (GEPAPP) and ecosystem respiration (ERAPP) at the nine sites (denoted as in Figures 2-4) during the year in which potential NEP (NEPPOT) occurred. Blue, green and red dots and horizontal dotted lines indicate timing and magnitude of NEPPOT and of GEPAPP and ERAPP at the time of NEPPOT (GEPPOT and ERPOT, respectively). Double arrows visualize the difference between GEPPOT and ERPOT. Vertical dotted arrows indicate harvest events. (b) regression between GEPPOT and ERPOT; thick lines indicate linear fits for all sites (black line) and the six conserving sites (red line); thin solid and dashed lines show 1:1 and 2:1 fits, respectively; GEP and ER are shown in absolute values.

Figure 5