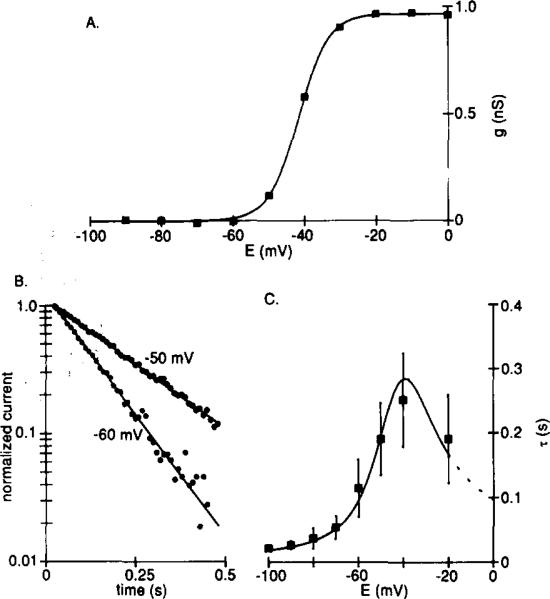
Figure 3. Time and Voltage Dependence of IKx.
Recordings were made from ceils bathed in Ringer solution containing 5 mM Cs+ and 0.1 mM Cd2+.
(A) Voltage dependence of activation for a typical experiment. Peak tail currents at –30 mV (the same protocol as shown in Figure 2A) were converted to conductance and plotted against conditioning potential. The reversal potential for IKx was taken as –74 mV (see Figure 4), zero conductance corresponds to the minimum value of gKx, and the smooth curve is the Boltzmann equation fitted using a least-squares method.
(B) Deactivation of IKx described by a single exponential. Hyperpolarizing voltage steps (1 s) were applied from a holding potential of –30 mV, and exponentials were fitted to the current decay using a nonlinear least-squares method. The currents (circles) and exponentials (continuous lines) are shown normalized and on a semilogarithmic scale for two test potentials.
(C) Time constants (τ) of exponentials fitted to the decay of IKx (means ± SD, n = 5–8) plotted against test potential. The smooth curve is 1/(α + β), in which α and β are rate constants for transitions between the closed and open states of the channels. Mean values for α and β (n = 6) were calculated from α = A∞/τ and β = (1 – A∞)/τ (Hodgkin and Huxley, 1952), in which A∞ is the normalized steady-state conductance, and τ is the time constant (s) of the fitted exponential. α and β were fitted by eye with the functions: α = 0.23(E + 45)/(1 – exp(– (E + 45)/7)); β = 1.2(E + 55)/(exp((E + 55)/5.5) – 1), in which E is the membrane potential (mV).

