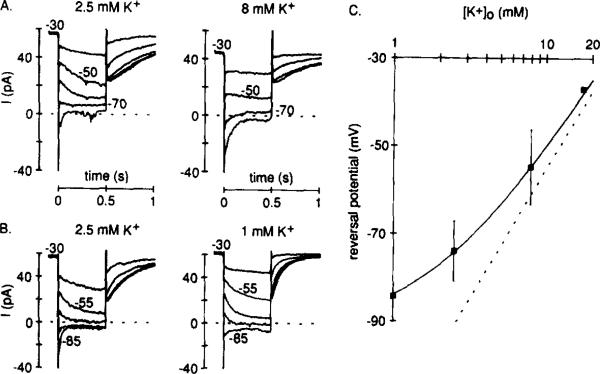
Figure 4. Reversal Potential for IKx.
Recordings were made from cells bathed in Ringer solution containing 5 mM Cs+ and 0.1 mM Cd2+.
Hyperpolarizing voltage steps (not shown) wereapplied from a holding potential of –30 mV. Current (shown) was measured at the beginning and the end of the hyperpolarizing steps: the difference (beginning minus end) was then plotted against test voltage, and the reversal potential was estimated (data not shown). Recordings were first made in 2.5 mM external K+ and then the external K+ concentration was (A) raised to 8 mM or (B) lowered to 1 mM. (C) Reversal potentials plotted against the logarithm of the external K+ concentration. The points are means (±SD) measured in 1 (n = 3), 2.5 (n = 8), 8 (n = 4), and 17.5 (n = 1) mM K+. The broken line shows the Nernst relation for a pure K+ electrode, and the continuous line is the Goldman-Hodgkin-Katz voltage equation fitted by eye (PNa/PK = 0.024).

