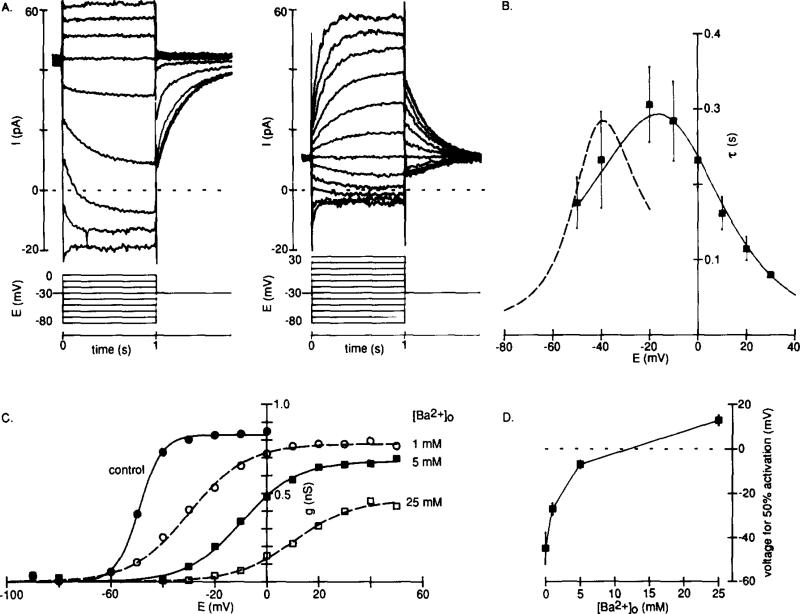
Figure 5. Modification of IKx by External Ba2+.
Recordings were made from cells bathed in Ringer solution containing 5 mM Cs+ and 0.1 mM Cd2+.
(A) Whole-cell current in response to voltage steps from –30 mV before (left) and after (right) 5 mM Ba2+ was added to the Cs+- and Cd2+-containing Ringer solution (note that more depolarizing steps are shown after Ba2+ application).
(B) Time-dependent current in 5 mM Ba2+ had kinetics similar to those of the control IKx. The points are mean time constants, τ (±SD, n = 3–6), of single exponentials fitted to the time-dependent current component elicited by test steps from –30 mV in 5 mM Ba2+. The continuous smooth curve describes 1/(α + β) (derived as in Figure 3C) and was estimated for data from six experiments in 5 mM BaCl2. The broken curve is the control repeated from Figure 3C.
(C) Activation curves, from tail currents measured at –30 mV, for IKx in 0 (closed circles), 1 (open circles), 5 (closed squares), and 25 (open squares) mM added Ba2+. The smooth curves are the Boltzmann equation fitted using a least-squares method. The midpoint of the activation curve in 5 mM Ba2+ was –6.9 ± 1.7 mV, with a slope factor of 11.2 ± 0.9 mV (means ± SD, n = 7).
(D) Concentration dependence of the Ba2+-induced shifts in the midpoint of the activation curve for IKx. The points are means (±SD) for cells in 0 (n = 7), 1 (n = 4), 5 (n = 7), or 25 (n = 3) mM added Ba2+.

