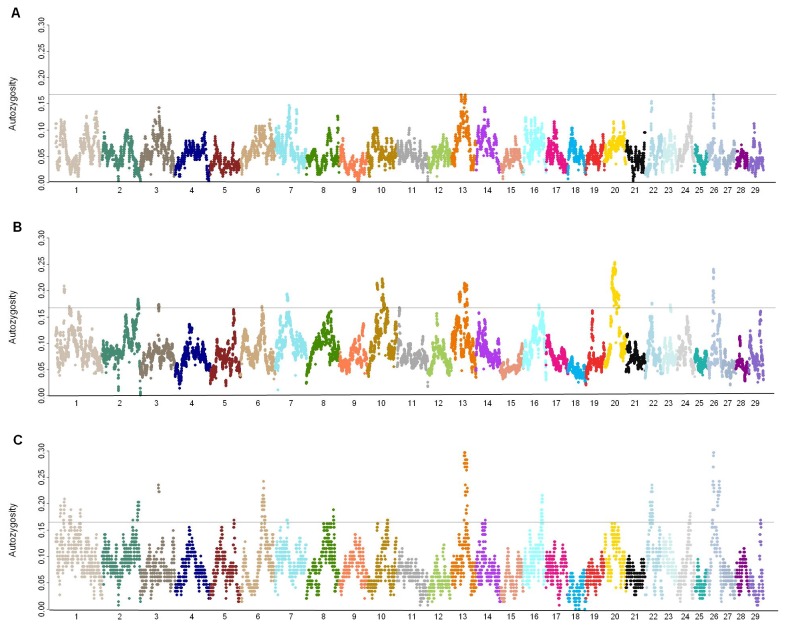
Figure 1. Genome-wide patterns of F L within Groups.
Manhattan plots of autozygosity were generated using the F L values (y-axis) for each SNP locus relative to its genome coordinate (x-axis; Chr indicated) for A) Group I, B) Group II-A, and C) Group II-B. The grey horizintal line indicates the threshold for FL > 0.16, which represents approximately the top 2.5% of autozygosity detected.

