
Figure 4. Associations between the most frequent haplotype and birth year and milk yield traits.
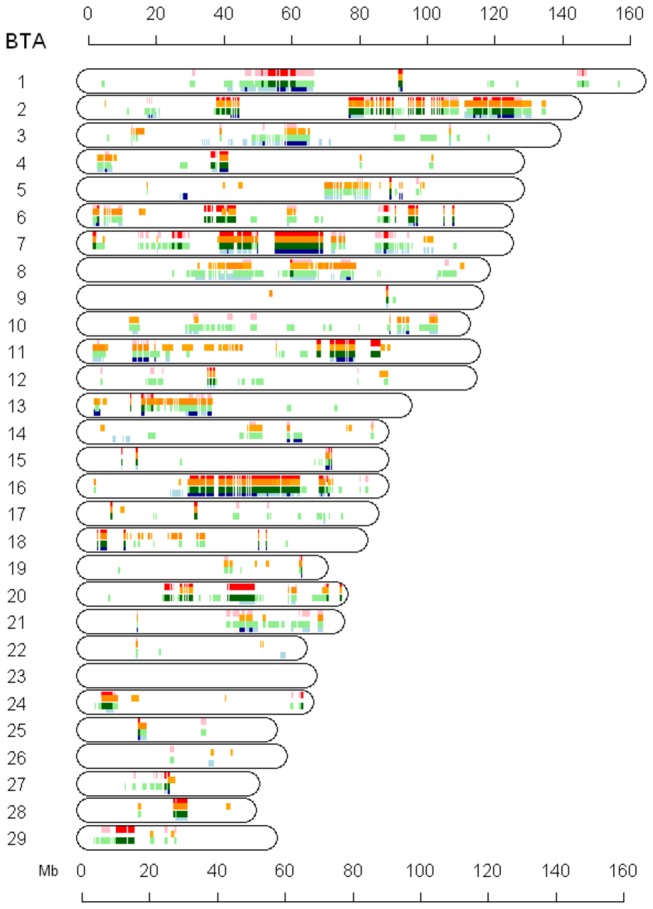
Associations are plotted against chromosomal regions. Red, blue, orange, and green bars denote an association between Group II-A haplotypes and birth year, milk yield, fat, and protein, respectively (light color = suggestive at p<0.05, dark color = significant at p<0.01).