
Fig. 1.
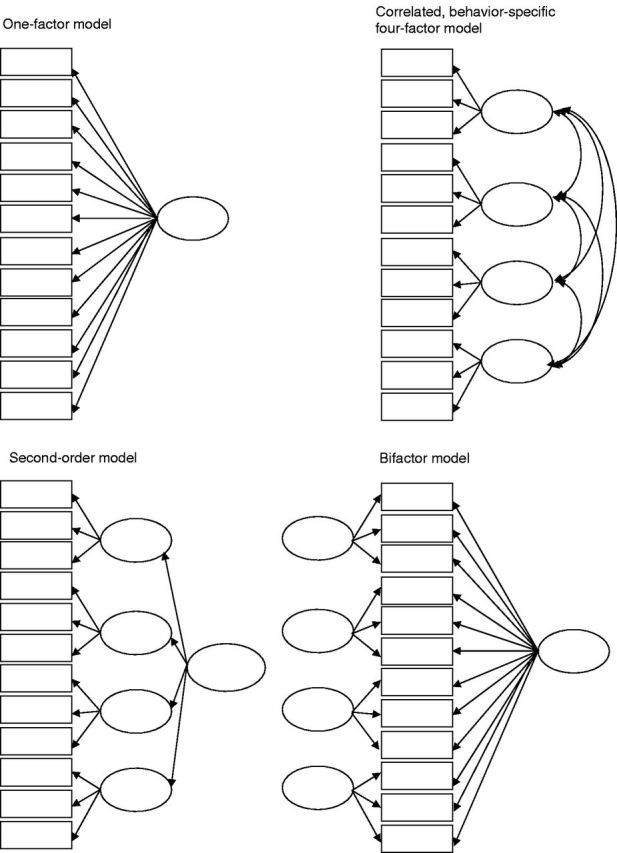
Graphical representations of hypothesized models. Rectangles represent observed variables (items) and ovals represent factors (latent variables). Errors, disturbances and item labels have been omitted for clarity.
Official websites use .gov
A
.gov website belongs to an official
government organization in the United States.
Secure .gov websites use HTTPS
A lock (
) or https:// means you've safely
connected to the .gov website. Share sensitive
information only on official, secure websites.
Graphical representations of hypothesized models. Rectangles represent observed variables (items) and ovals represent factors (latent variables). Errors, disturbances and item labels have been omitted for clarity.